| Red | Green | Blue | |
| z | 17.64 | ||
| znorm | Inf | ||
| sky | -NaN | -NaN | -NaN |
| S/N | 20.3 | 32.6 | 37.2 |
| S/N(c) | 0.0 | 0.0 | 0.0 |
| SN(E/C) |
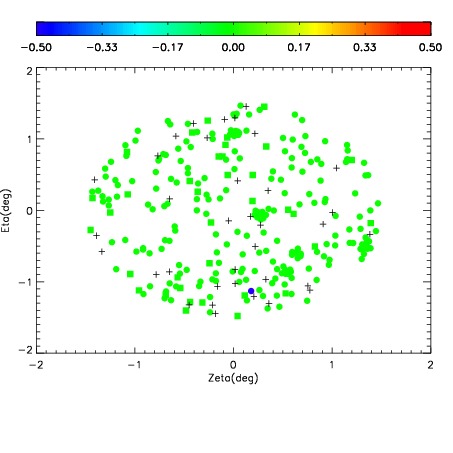
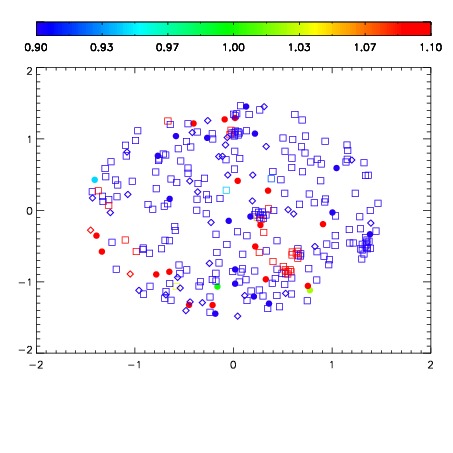


| Frame | Nreads | Zeropoints | Mag plots | Spatial mag deviation | Spatial sky 16325A emission deviations (filled: sky, open: star) | Spatial sky continuum emission | Spatial sky telluric CO2 absorption deviations (filled: H < 10) | |||||||||||||||||||||||
| 0 | 0 |
|
|
|
|
|
|
| IPAIR | NAME | SHIFT | NEWSHIFT | S/N | NAME | SHIFT | NEWSHIFT | S/N |
| 0 | 17600050 | 0.00528066 | 0.00000 | 17.3474 | 17600045 | -0.494834 | 0.500115 | 18.7264 |
| 1 | 17600043 | 0.00000 | 0.00528066 | 19.0854 | 17600048 | -0.502329 | 0.507610 | 19.0965 |
| 2 | 17600047 | 0.00210077 | 0.00317989 | 18.6854 | 17600044 | -0.495401 | 0.500682 | 19.0929 |
| 3 | 17600046 | 0.00195717 | 0.00332349 | 18.2320 | 17600049 | -0.501970 | 0.507251 | 18.9776 |