| Red | Green | Blue | |
| z | 17.64 | ||
| znorm | Inf | ||
| sky | -Inf | -Inf | -NaN |
| S/N | 30.1 | 51.9 | 60.5 |
| S/N(c) | 0.0 | 0.0 | 0.0 |
| SN(E/C) |
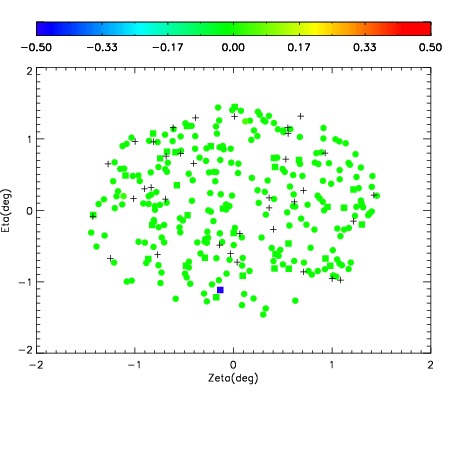
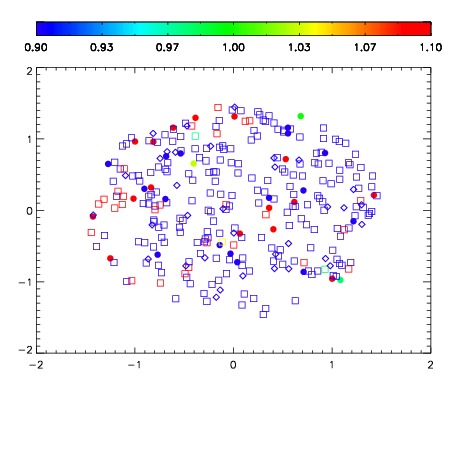
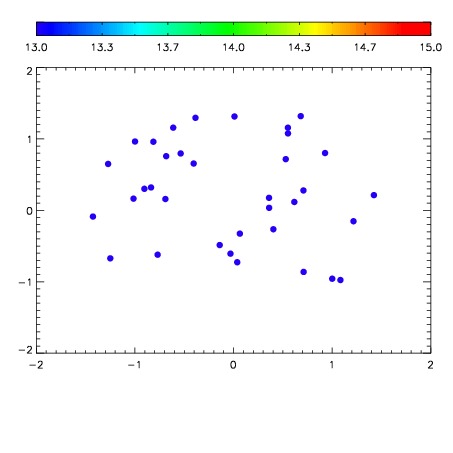

| Frame | Nreads | Zeropoints | Mag plots | Spatial mag deviation | Spatial sky 16325A emission deviations (filled: sky, open: star) | Spatial sky continuum emission | Spatial sky telluric CO2 absorption deviations (filled: H < 10) | |||||||||||||||||||||||
| 0 | 0 |
|
|
|
|
|
|
| IPAIR | NAME | SHIFT | NEWSHIFT | S/N | NAME | SHIFT | NEWSHIFT | S/N |
| 0 | 17310082 | 0.507716 | 0.00000 | 19.2599 | 17310080 | 0.00134499 | 0.506371 | 19.2662 |
| 1 | 17310081 | 0.507214 | 0.000501990 | 19.2441 | 17310083 | 0.00132594 | 0.506390 | 19.2411 |
| 2 | 17310078 | 0.506538 | 0.00117803 | 19.2208 | 17310079 | 0.00170964 | 0.506006 | 19.2378 |
| 3 | 17310077 | 0.506640 | 0.00107598 | 19.1908 | 17310076 | 0.00000 | 0.507716 | 19.1413 |