| Red | Green | Blue | |
| z | 17.64 | ||
| znorm | Inf | ||
| sky | -Inf | -Inf | -NaN |
| S/N | 29.5 | 49.9 | 56.7 |
| S/N(c) | 0.0 | 0.0 | 0.0 |
| SN(E/C) |
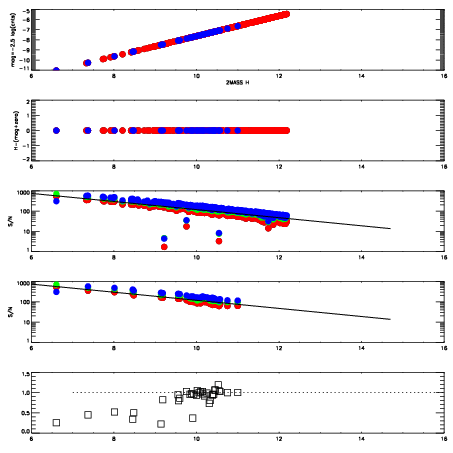
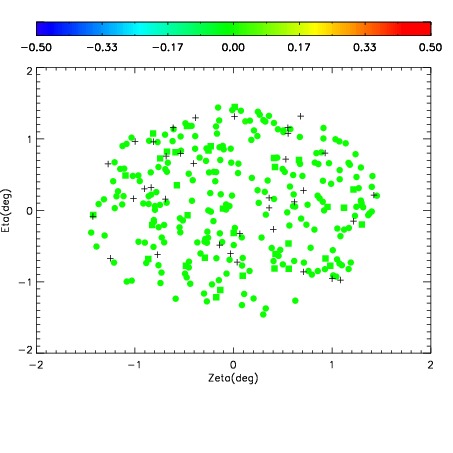
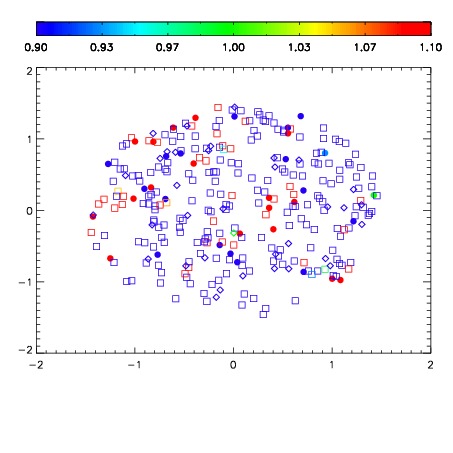
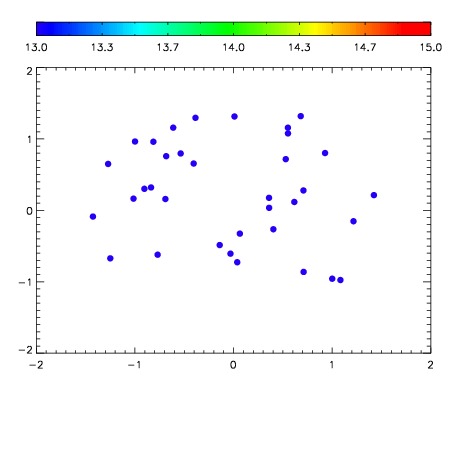

| Frame | Nreads | Zeropoints | Mag plots | Spatial mag deviation | Spatial sky 16325A emission deviations (filled: sky, open: star) | Spatial sky continuum emission | Spatial sky telluric CO2 absorption deviations (filled: H < 10) | |||||||||||||||||||||||
| 0 | 0 |
|
|
|
|
|
|
| IPAIR | NAME | SHIFT | NEWSHIFT | S/N | NAME | SHIFT | NEWSHIFT | S/N |
| 0 | 17650043 | 0.511883 | 0.00000 | 19.1799 | 17650041 | 0.00259884 | 0.509284 | 19.1881 |
| 1 | 17650042 | 0.510250 | 0.00163305 | 19.1944 | 17650044 | 0.00623136 | 0.505652 | 19.1916 |
| 2 | 17650039 | 0.509865 | 0.00201803 | 19.1680 | 17650040 | 0.00281551 | 0.509068 | 19.1697 |
| 3 | 17650038 | 0.508349 | 0.00353402 | 19.1558 | 17650037 | 0.00000 | 0.511883 | 19.1159 |