| Red | Green | Blue | |
| z | 17.64 | ||
| znorm | Inf | ||
| sky | -Inf | -Inf | -NaN |
| S/N | 27.9 | 45.4 | 53.4 |
| S/N(c) | 0.0 | 0.0 | 0.0 |
| SN(E/C) |
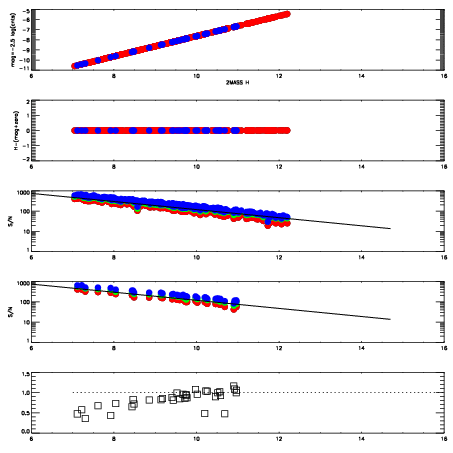


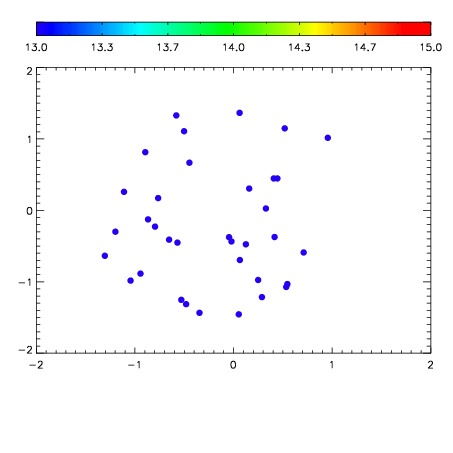

| Frame | Nreads | Zeropoints | Mag plots | Spatial mag deviation | Spatial sky 16325A emission deviations (filled: sky, open: star) | Spatial sky continuum emission | Spatial sky telluric CO2 absorption deviations (filled: H < 10) | |||||||||||||||||||||||
| 0 | 0 |
|
|
|
|
|
|
| IPAIR | NAME | SHIFT | NEWSHIFT | S/N | NAME | SHIFT | NEWSHIFT | S/N |
| 0 | 17020067 | 0.471030 | 0.00000 | 19.1102 | 17020069 | 8.59407e-05 | 0.470944 | 19.1192 |
| 1 | 17020070 | 0.466542 | 0.00448799 | 19.1233 | 17020072 | -0.00278883 | 0.473819 | 19.1683 |
| 2 | 17020071 | 0.465687 | 0.00534299 | 19.1086 | 17020068 | 0.00113471 | 0.469895 | 19.0558 |
| 3 | 17020066 | 0.469710 | 0.00132000 | 19.0922 | 17020065 | 0.00000 | 0.471030 | 19.0379 |