| Red | Green | Blue | |
| z | 17.64 | ||
| znorm | Inf | ||
| sky | -Inf | -Inf | -Inf |
| S/N | 25.1 | 38.8 | 48.2 |
| S/N(c) | 0.0 | 0.0 | 0.0 |
| SN(E/C) |
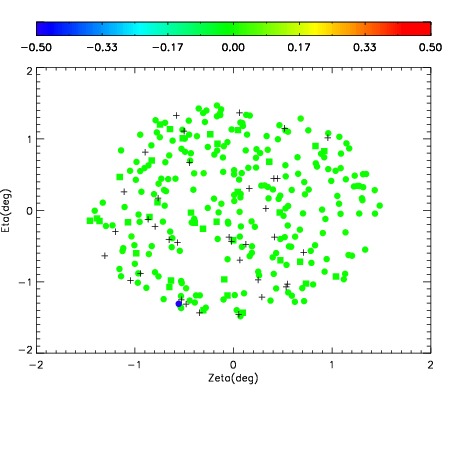
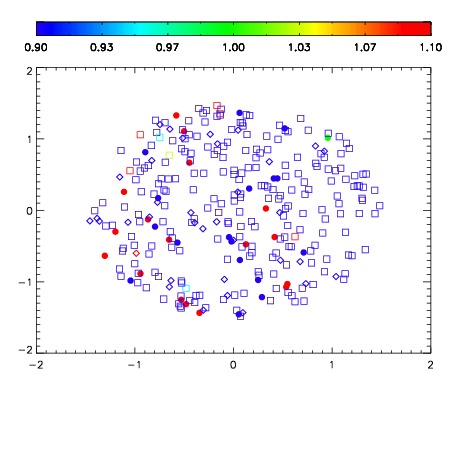
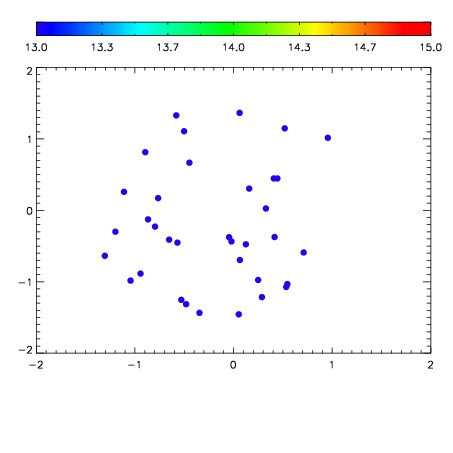

| Frame | Nreads | Zeropoints | Mag plots | Spatial mag deviation | Spatial sky 16325A emission deviations (filled: sky, open: star) | Spatial sky continuum emission | Spatial sky telluric CO2 absorption deviations (filled: H < 10) | |||||||||||||||||||||||
| 0 | 0 |
|
|
|
|
|
|
| IPAIR | NAME | SHIFT | NEWSHIFT | S/N | NAME | SHIFT | NEWSHIFT | S/N |
| 0 | 17070063 | 0.478990 | 0.00000 | 18.9513 | 17070061 | 0.00220558 | 0.476784 | 18.0677 |
| 1 | 17070059 | 0.475976 | 0.00301400 | 19.1383 | 17070058 | 0.00000 | 0.478990 | 18.9902 |
| 2 | 17070064 | 0.477815 | 0.00117499 | 19.0703 | 17070065 | 0.00149481 | 0.477495 | 18.9170 |
| 3 | 17070060 | 0.478349 | 0.000640988 | 18.9893 | 17070062 | 0.00177554 | 0.477214 | 18.2095 |