| Red | Green | Blue | |
| z | 17.64 | ||
| znorm | Inf | ||
| sky | -Inf | -Inf | -Inf |
| S/N | 29.7 | 50.5 | 56.9 |
| S/N(c) | 0.0 | 0.0 | 0.0 |
| SN(E/C) |
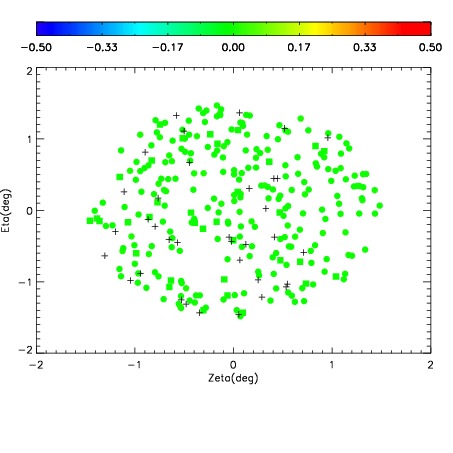
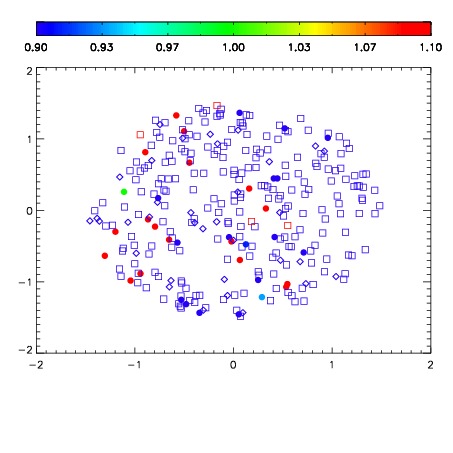
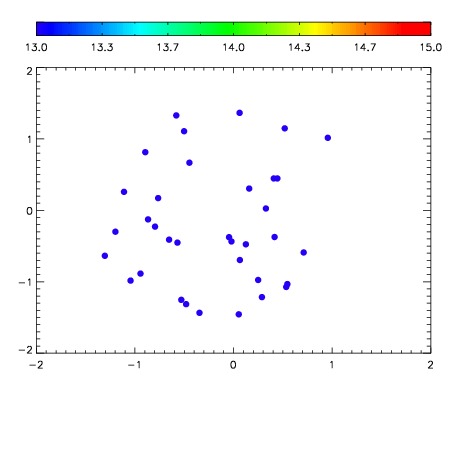

| Frame | Nreads | Zeropoints | Mag plots | Spatial mag deviation | Spatial sky 16325A emission deviations (filled: sky, open: star) | Spatial sky continuum emission | Spatial sky telluric CO2 absorption deviations (filled: H < 10) | |||||||||||||||||||||||
| 0 | 0 |
|
|
|
|
|
|
| IPAIR | NAME | SHIFT | NEWSHIFT | S/N | NAME | SHIFT | NEWSHIFT | S/N |
| 0 | 17300060 | 0.494962 | 0.00000 | 19.1973 | 17300059 | 0.00000 | 0.494962 | 19.1822 |
| 1 | 17300061 | 0.494242 | 0.000719994 | 19.2401 | 17300066 | 0.00221102 | 0.492751 | 19.2255 |
| 2 | 17300065 | 0.493975 | 0.000986993 | 19.2343 | 17300063 | 0.00168061 | 0.493281 | 19.2249 |
| 3 | 17300064 | 0.493354 | 0.00160801 | 19.2226 | 17300062 | 0.00160012 | 0.493362 | 19.2065 |