| Red | Green | Blue | |
| z | 17.64 | ||
| znorm | Inf | ||
| sky | -Inf | -Inf | -Inf |
| S/N | 27.6 | 42.4 | 48.7 |
| S/N(c) | 0.0 | 0.0 | 0.0 |
| SN(E/C) |
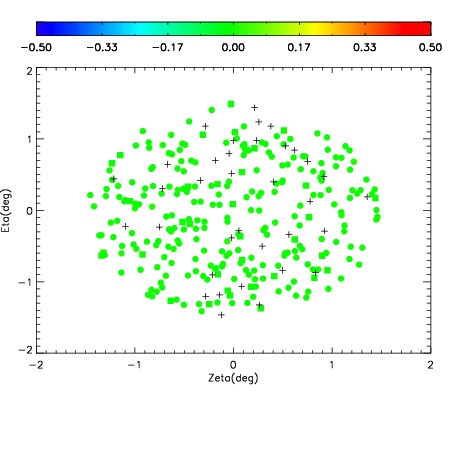
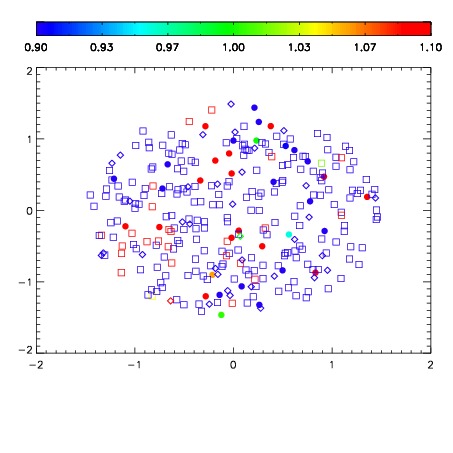
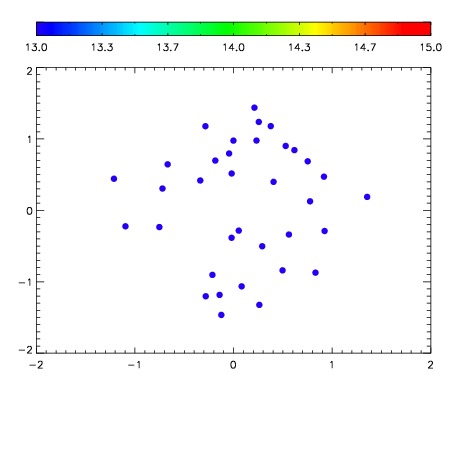

| Frame | Nreads | Zeropoints | Mag plots | Spatial mag deviation | Spatial sky 16325A emission deviations (filled: sky, open: star) | Spatial sky continuum emission | Spatial sky telluric CO2 absorption deviations (filled: H < 10) | |||||||||||||||||||||||
| 0 | 0 |
|
|
|
|
|
|
| IPAIR | NAME | SHIFT | NEWSHIFT | S/N | NAME | SHIFT | NEWSHIFT | S/N |
| 0 | 14650038 | 0.486454 | 0.00000 | 19.1114 | 14650041 | -0.00167119 | 0.488125 | 19.1077 |
| 1 | 14650042 | 0.485453 | 0.00100100 | 19.1138 | 14650037 | 0.00000 | 0.486454 | 19.1261 |
| 2 | 14650043 | 0.485847 | 0.000607014 | 19.1043 | 14650044 | -0.00283444 | 0.489288 | 19.0977 |
| 3 | 14650039 | 0.486240 | 0.000214010 | 19.0803 | 14650040 | -0.00163298 | 0.488087 | 18.9900 |