| Red | Green | Blue | |
| z | 17.64 | ||
| znorm | Inf | ||
| sky | -Inf | -Inf | -Inf |
| S/N | 26.4 | 43.2 | 47.4 |
| S/N(c) | 0.0 | 0.0 | 0.0 |
| SN(E/C) |
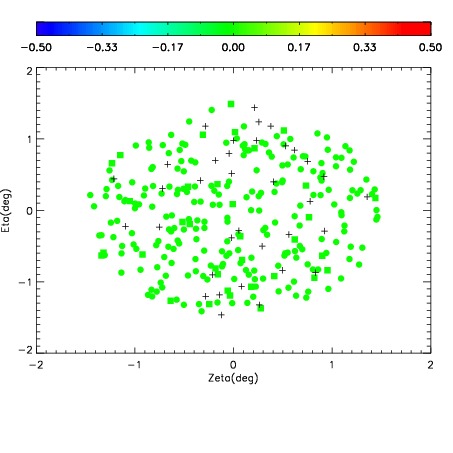
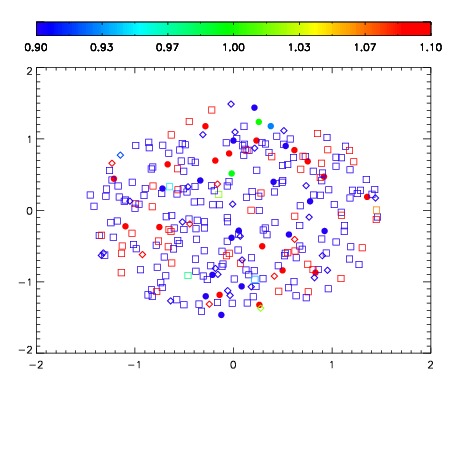
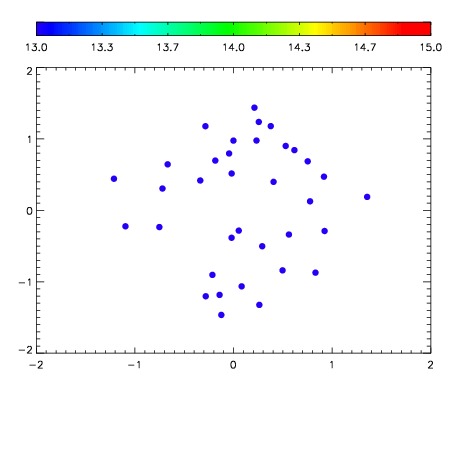

| Frame | Nreads | Zeropoints | Mag plots | Spatial mag deviation | Spatial sky 16325A emission deviations (filled: sky, open: star) | Spatial sky continuum emission | Spatial sky telluric CO2 absorption deviations (filled: H < 10) | |||||||||||||||||||||||
| 0 | 0 |
|
|
|
|
|
|
| IPAIR | NAME | SHIFT | NEWSHIFT | S/N | NAME | SHIFT | NEWSHIFT | S/N |
| 0 | 14680013 | 0.496617 | 0.00000 | 18.9614 | 14680015 | -0.00176792 | 0.498385 | 18.9612 |
| 1 | 14680012 | 0.495563 | 0.00105399 | 19.0004 | 14680011 | 0.00000 | 0.496617 | 18.9908 |
| 2 | 14680016 | 0.495963 | 0.000653982 | 18.9081 | 14680014 | -0.00174640 | 0.498363 | 18.9370 |
| 3 | 14680017 | 0.496233 | 0.000384003 | 18.8946 | 14680018 | -0.00263556 | 0.499253 | 18.8970 |