| Red | Green | Blue | |
| z | 17.64 | ||
| znorm | Inf | ||
| sky | -Inf | -Inf | -Inf |
| S/N | 22.5 | 34.8 | 42.5 |
| S/N(c) | 0.0 | 0.0 | 0.0 |
| SN(E/C) |

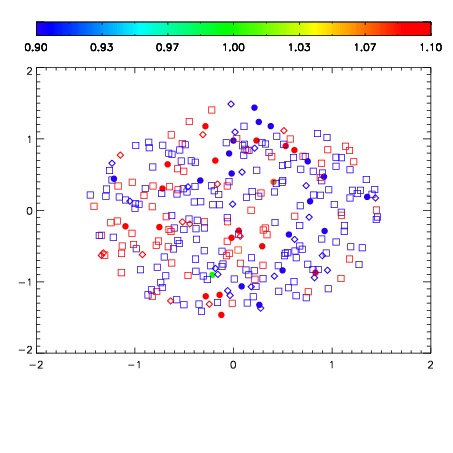


| Frame | Nreads | Zeropoints | Mag plots | Spatial mag deviation | Spatial sky 16325A emission deviations (filled: sky, open: star) | Spatial sky continuum emission | Spatial sky telluric CO2 absorption deviations (filled: H < 10) | |||||||||||||||||||||||
| 0 | 0 |
|
|
|
|
|
|
| IPAIR | NAME | SHIFT | NEWSHIFT | S/N | NAME | SHIFT | NEWSHIFT | S/N |
| 0 | 14960017 | 0.500266 | 0.00000 | 18.5602 | 14960018 | 0.00154875 | 0.498717 | 18.4817 |
| 1 | 14960012 | 0.497953 | 0.00231302 | 19.0500 | 14960011 | 0.00000 | 0.500266 | 19.0539 |
| 2 | 14960013 | 0.499156 | 0.00111002 | 19.0275 | 14960015 | -0.000625754 | 0.500892 | 18.9380 |
| 3 | 14960016 | 0.498262 | 0.00200403 | 18.9000 | 14960014 | 7.09011e-05 | 0.500195 | 18.6738 |