| Red | Green | Blue | |
| z | 17.64 | ||
| znorm | Inf | ||
| sky | -Inf | -Inf | -NaN |
| S/N | 14.8 | 27.9 | 27.0 |
| S/N(c) | 0.0 | 0.0 | 0.0 |
| SN(E/C) |
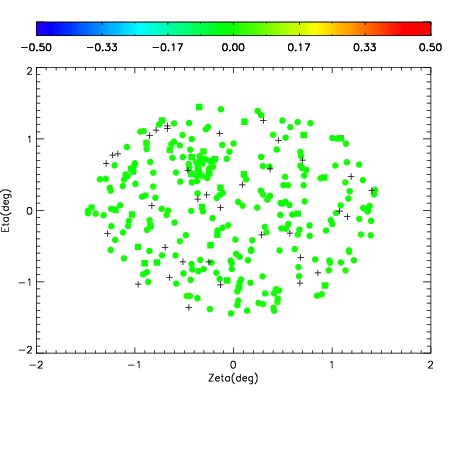
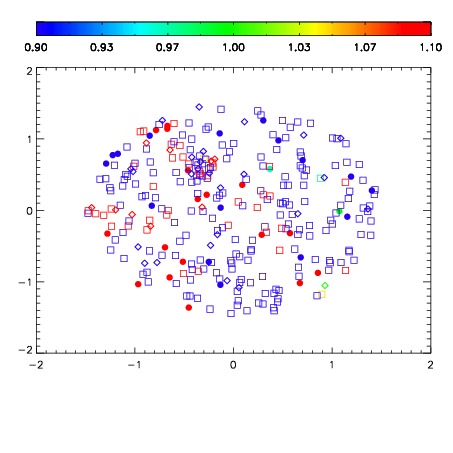
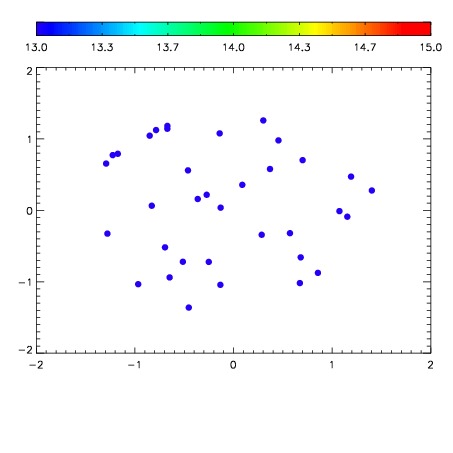

| Frame | Nreads | Zeropoints | Mag plots | Spatial mag deviation | Spatial sky 16325A emission deviations (filled: sky, open: star) | Spatial sky continuum emission | Spatial sky telluric CO2 absorption deviations (filled: H < 10) | |||||||||||||||||||||||
| 0 | 0 |
|
|
|
|
|
|
| IPAIR | NAME | SHIFT | NEWSHIFT | S/N | NAME | SHIFT | NEWSHIFT | S/N |
| 0 | 14150022 | 0.505680 | 0.00000 | 15.6299 | 14150017 | 0.00000 | 0.505680 | 18.3324 |
| 1 | 14150018 | 0.500525 | 0.00515503 | 18.5823 | 14150020 | 0.000668062 | 0.505012 | 18.4224 |
| 2 | 14150019 | 0.501820 | 0.00386000 | 18.4651 | 14150021 | 8.94190e-05 | 0.505591 | 18.3833 |