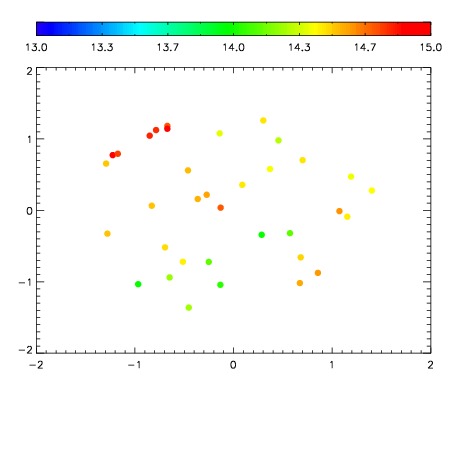
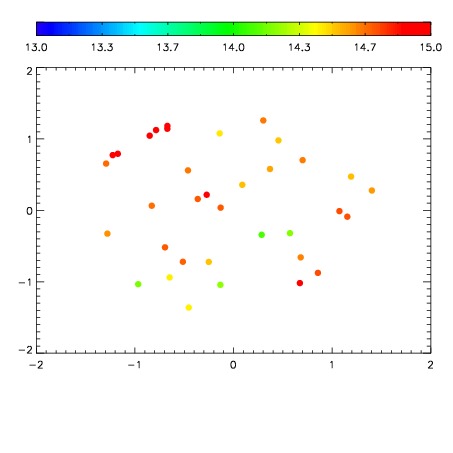
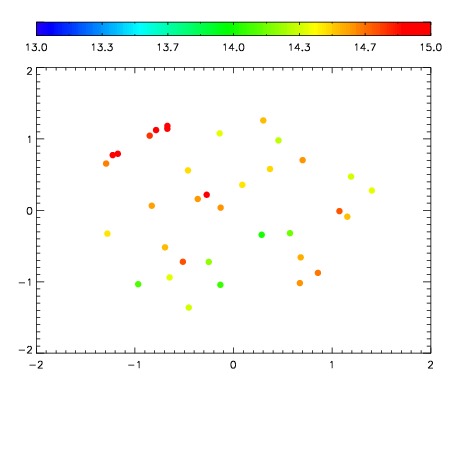
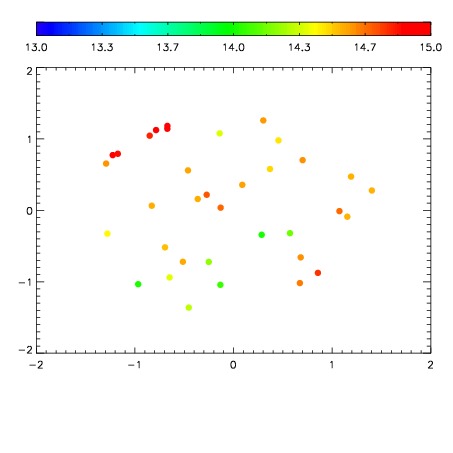
| Frame | Nreads | Zeropoints | Mag plots
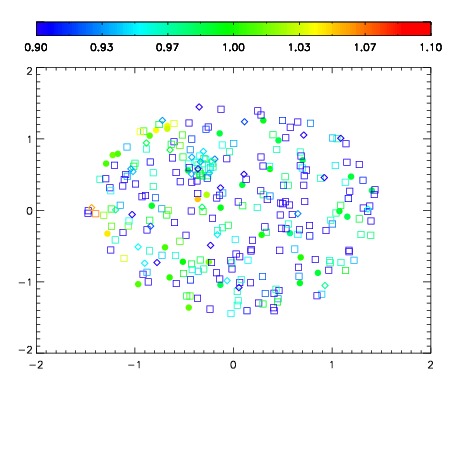
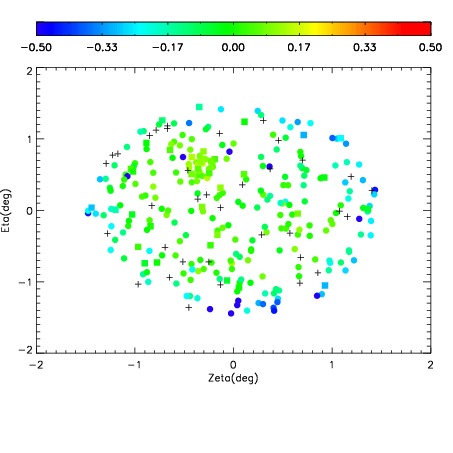
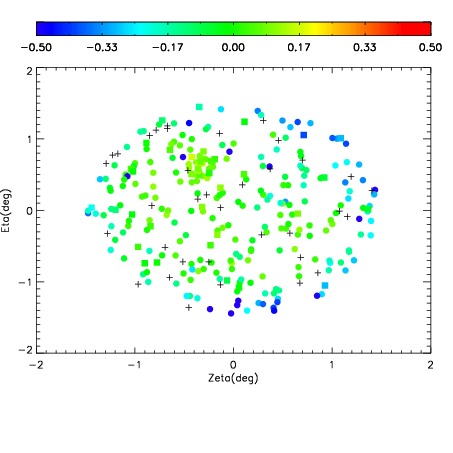
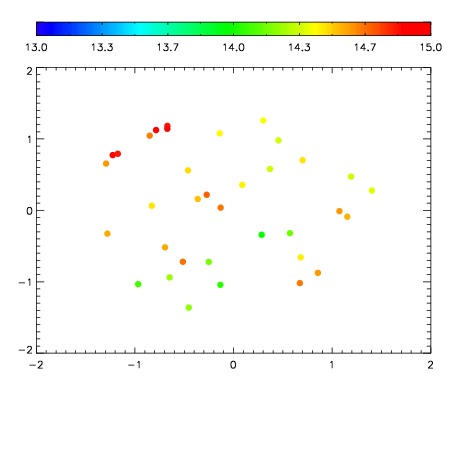
| Spatial mag deviation
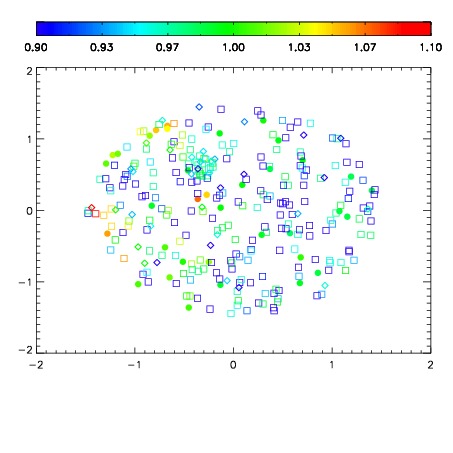
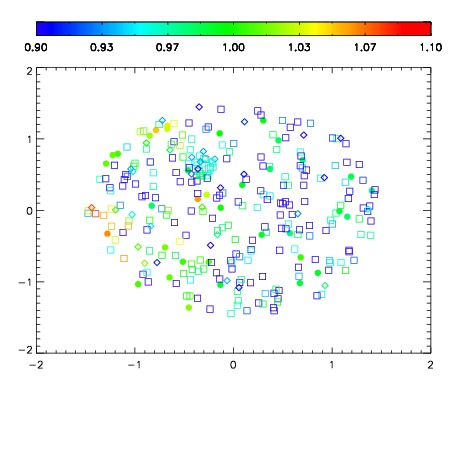
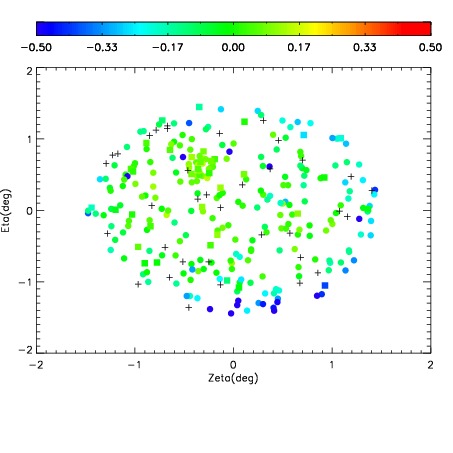
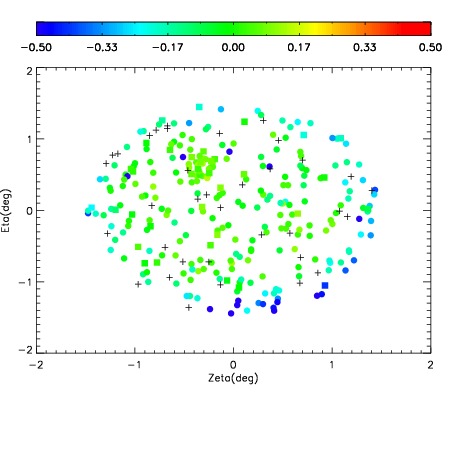
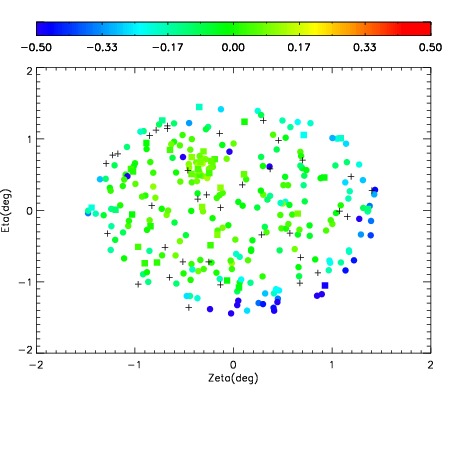
| Spatial sky 16325A emission deviations (filled: sky, open: star)
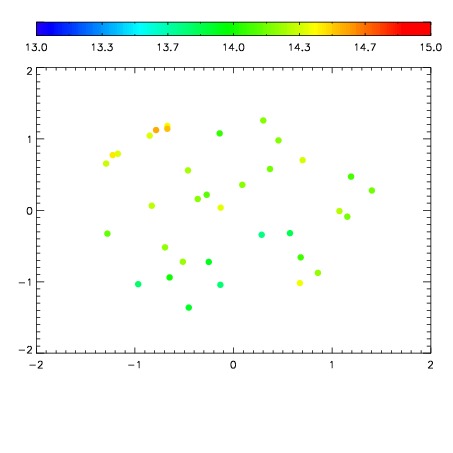
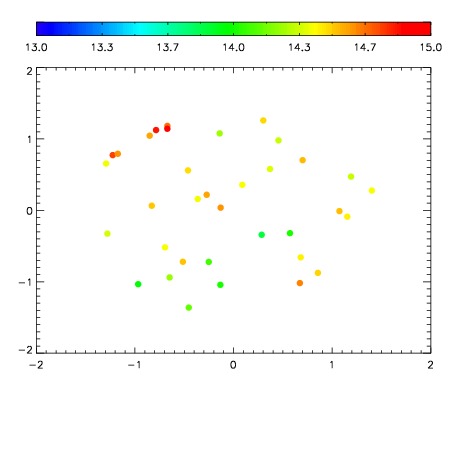
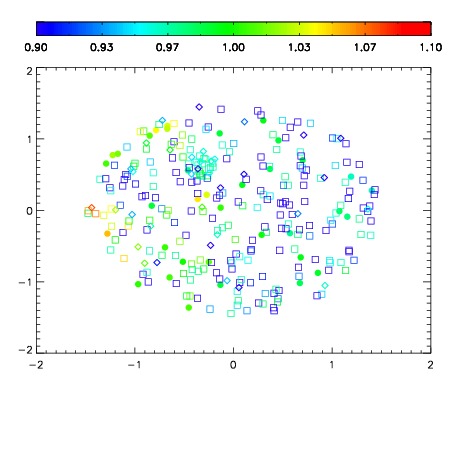
| Spatial sky continuum emission
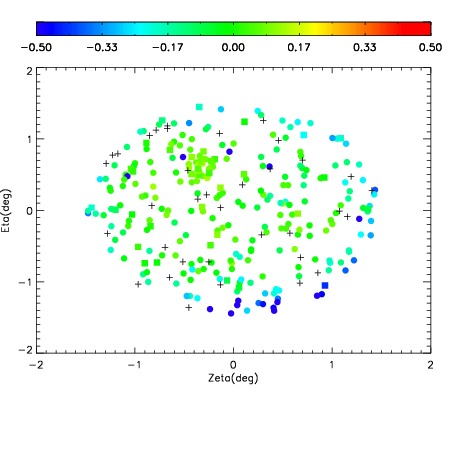
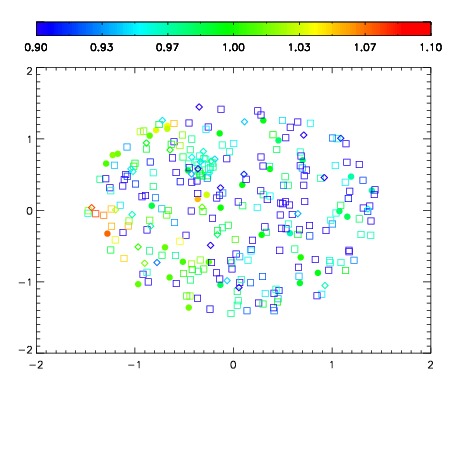
| Spatial sky telluric CO2 absorption deviations (filled: H < 10)
|
| 14290062
| 47
| | Red | Green | Blue
| | z | | 19.13
| | znorm | | 14.95
| | sky | 14.5 | 14.2 | 14.5
| | S/N | 17.0 | 27.1 | 27.5
| | S/N(c) | 45.6 | 12.5 | 12.9
| | SN(E/C) 0.93
|
| 
| 
| 
| 
| 
|
| 14290063
| 47
| | Red | Green | Blue
| | z | | 19.10
| | znorm | | 14.92
| | sky | 14.7 | 14.4 | 14.6
| | S/N | 16.0 | 26.1 | 26.5
| | S/N(c) | 44.7 | 12.5 | 12.7
| | SN(E/C) 0.96
|
| 
| 
| 
| 
| 
|
| 14290064
| 47
| | Red | Green | Blue
| | z | | 19.09
| | znorm | | 14.91
| | sky | 14.6 | 14.4 | 14.6
| | S/N | 15.7 | 25.7 | 25.5
| | S/N(c) | 44.2 | 12.3 | 12.5
| | SN(E/C) 0.97
|
| 
| 
| 
| 
| 
|
| 14290065
| 47
| | Red | Green | Blue
| | z | | 19.12
| | znorm | | 14.94
| | sky | 14.8 | 14.5 | 14.5
| | S/N | 16.1 | 26.6 | 26.6
| | S/N(c) | 44.7 | 12.6 | 12.7
| | SN(E/C) 0.96
|
| 
| 
| 
| 
| 
|
| 14290066
| 47
| | Red | Green | Blue
| | z | | 19.03
| | znorm | | 14.85
| | sky | 14.7 | 14.6 | 14.6
| | S/N | 15.5 | 25.5 | 25.6
| | S/N(c) | 42.9 | 12.0 | 12.2
| | SN(E/C) 0.97
|
| 
| 
| 
| 
| 
|
| 14290067
| 47
| | Red | Green | Blue
| | z | | 19.02
| | znorm | | 14.84
| | sky | 14.9 | 14.6 | 14.8
| | S/N | 15.2 | 25.2 | 25.3
| | S/N(c) | 42.3 | 12.0 | 12.1
| | SN(E/C) 0.98
|
| 
| 
| 
| 
| 
|
| 14290068
| 47
| | Red | Green | Blue
| | z | | 19.01
| | znorm | | 14.83
| | sky | 14.8 | 14.7 | 14.6
| | S/N | 15.0 | 25.2 | 25.1
| | S/N(c) | 42.4 | 12.1 | 12.2
| | SN(E/C) 1.00
|
| 
| 
| 
| 
| 
|
| 14290069
| 47
| | Red | Green | Blue
| | z | | 19.05
| | znorm | | 14.87
| | sky | 14.6 | 14.5 | 14.7
| | S/N | 15.7 | 26.0 | 25.9
| | S/N(c) | 43.1 | 12.2 | 12.3
| | SN(E/C) 1.00
|
| 
| 
| 
| 
| 
|
| 14290070
| 47
| | Red | Green | Blue
| | z | | 19.03
| | znorm | | 14.85
| | sky | 14.8 | 14.5 | 14.6
| | S/N | 15.4 | 25.7 | 25.7
| | S/N(c) | 42.8 | 12.1 | 12.1
| | SN(E/C) 0.96
|
| 
| 
| 
| 
| 
|
| 14290071
| 47
| | Red | Green | Blue
| | z | | 19.07
| | znorm | | 14.89
| | sky | 14.6 | 14.6 | 14.7
| | S/N | 15.4 | 26.0 | 25.8
| | S/N(c) | 43.4 | 12.3 | 12.4
| | SN(E/C) 0.94
|
| 
| 
| 
| 
| 
|