| Red | Green | Blue | |
| z | 17.64 | ||
| znorm | Inf | ||
| sky | -NaN | -Inf | -NaN |
| S/N | 31.5 | 54.5 | 54.7 |
| S/N(c) | 0.0 | 0.0 | 0.0 |
| SN(E/C) |
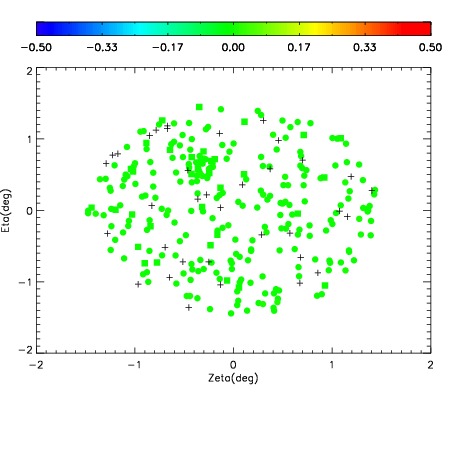
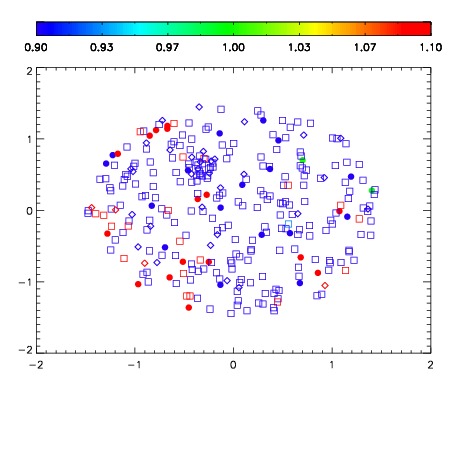
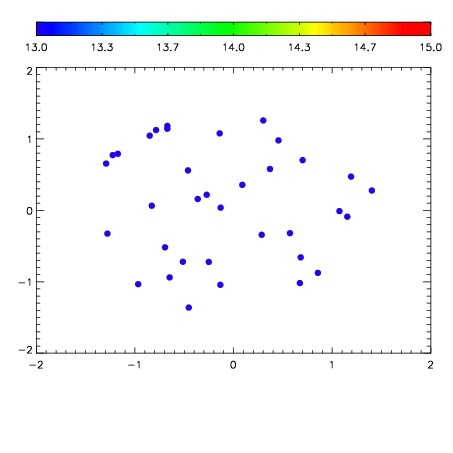

| Frame | Nreads | Zeropoints | Mag plots | Spatial mag deviation | Spatial sky 16325A emission deviations (filled: sky, open: star) | Spatial sky continuum emission | Spatial sky telluric CO2 absorption deviations (filled: H < 10) | |||||||||||||||||||||||
| 0 | 0 |
|
|
|
|
|
|
| IPAIR | NAME | SHIFT | NEWSHIFT | S/N | NAME | SHIFT | NEWSHIFT | S/N |
| 0 | 14290064 | 0.496024 | 0.00000 | 19.0834 | 14290065 | -0.000671758 | 0.496696 | 19.1166 |
| 1 | 14290063 | 0.493573 | 0.00245100 | 19.0939 | 14290062 | 0.00000 | 0.496024 | 19.1215 |
| 2 | 14290071 | 0.495302 | 0.000722021 | 19.0605 | 14290069 | -0.000903998 | 0.496928 | 19.0402 |
| 3 | 14290067 | 0.494113 | 0.00191101 | 19.0086 | 14290070 | -0.00164996 | 0.497674 | 19.0288 |
| 4 | 14290068 | 0.494824 | 0.00120002 | 19.0066 | 14290066 | -0.000497307 | 0.496521 | 19.0286 |