| Red | Green | Blue | |
| z | 17.64 | ||
| znorm | Inf | ||
| sky | -Inf | -Inf | -NaN |
| S/N | 21.8 | 37.3 | 37.3 |
| S/N(c) | 0.0 | 0.0 | 0.0 |
| SN(E/C) |
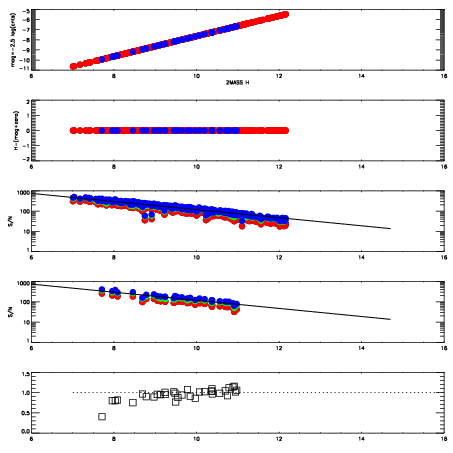
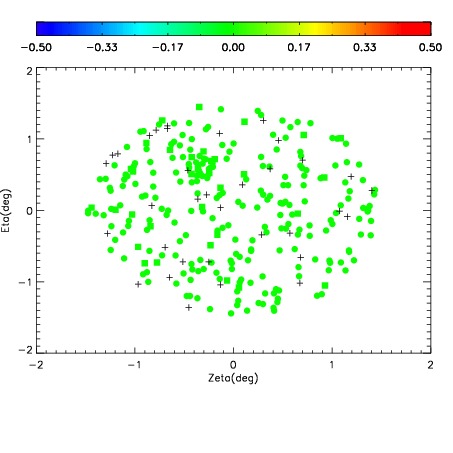
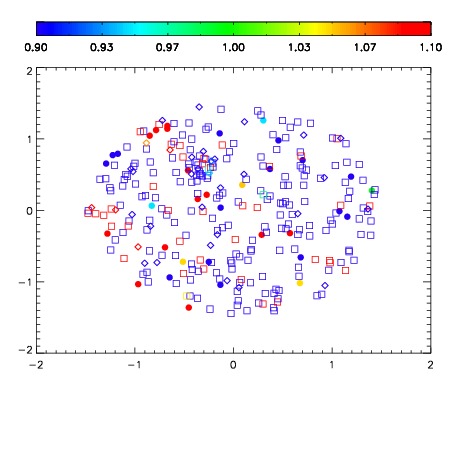


| Frame | Nreads | Zeropoints | Mag plots | Spatial mag deviation | Spatial sky 16325A emission deviations (filled: sky, open: star) | Spatial sky continuum emission | Spatial sky telluric CO2 absorption deviations (filled: H < 10) | |||||||||||||||||||||||
| 0 | 0 |
|
|
|
|
|
|
| IPAIR | NAME | SHIFT | NEWSHIFT | S/N | NAME | SHIFT | NEWSHIFT | S/N |
| 0 | 14890013 | 0.497007 | 0.00000 | 18.6387 | 14890011 | 0.00000 | 0.497007 | 18.6446 |
| 1 | 14890017 | 0.496606 | 0.000401020 | 18.7140 | 14890018 | -0.00246416 | 0.499471 | 18.8929 |
| 2 | 14890012 | 0.496944 | 6.30021e-05 | 18.7028 | 14890015 | -0.000484107 | 0.497491 | 18.6658 |
| 3 | 14890016 | 0.496806 | 0.000201017 | 18.5706 | 14890014 | -0.000463493 | 0.497470 | 18.6244 |