| Red | Green | Blue | |
| z | 17.64 | ||
| znorm | Inf | ||
| sky | -Inf | -Inf | -NaN |
| S/N | 29.2 | 48.3 | 53.0 |
| S/N(c) | 0.0 | 0.0 | 0.0 |
| SN(E/C) |
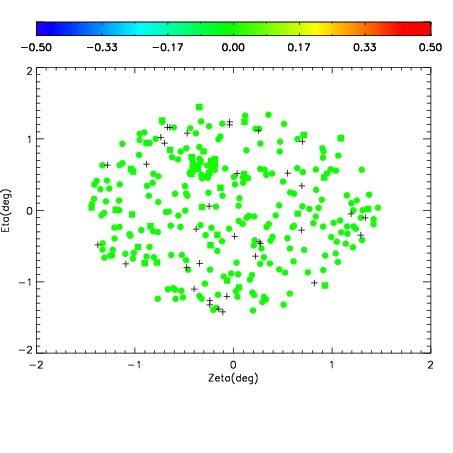
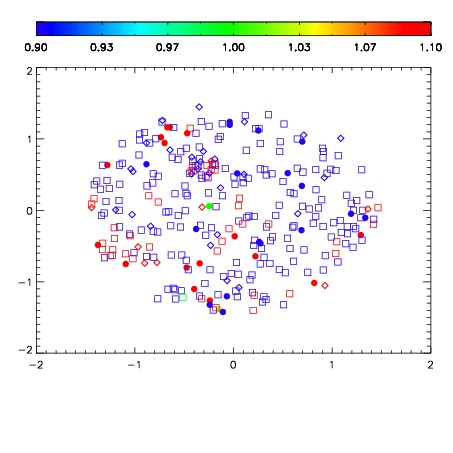
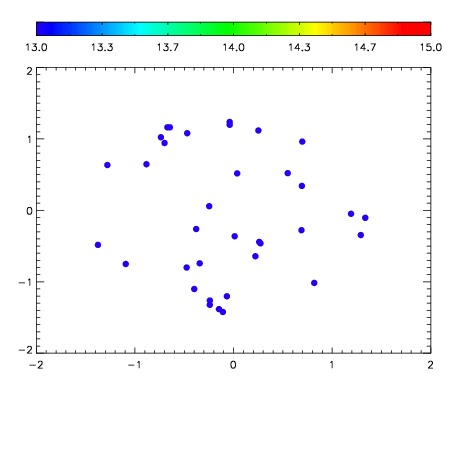

| Frame | Nreads | Zeropoints | Mag plots | Spatial mag deviation | Spatial sky 16325A emission deviations (filled: sky, open: star) | Spatial sky continuum emission | Spatial sky telluric CO2 absorption deviations (filled: H < 10) | |||||||||||||||||||||||
| 0 | 0 |
|
|
|
|
|
|
| IPAIR | NAME | SHIFT | NEWSHIFT | S/N | NAME | SHIFT | NEWSHIFT | S/N |
| 0 | 14300061 | 0.496110 | 0.00000 | 19.0705 | 14300059 | -0.000545945 | 0.496656 | 19.0421 |
| 1 | 14300056 | 0.495742 | 0.000367999 | 19.1107 | 14300055 | 0.00000 | 0.496110 | 19.1196 |
| 2 | 14300057 | 0.494417 | 0.00169298 | 19.0801 | 14300062 | -0.000309537 | 0.496420 | 19.0617 |
| 3 | 14300060 | 0.495823 | 0.000286996 | 19.0517 | 14300058 | -0.000596700 | 0.496707 | 18.9868 |