| Red | Green | Blue | |
| z | 17.64 | ||
| znorm | Inf | ||
| sky | -Inf | -Inf | -Inf |
| S/N | 30.6 | 47.9 | 57.1 |
| S/N(c) | 0.0 | 0.0 | 0.0 |
| SN(E/C) |
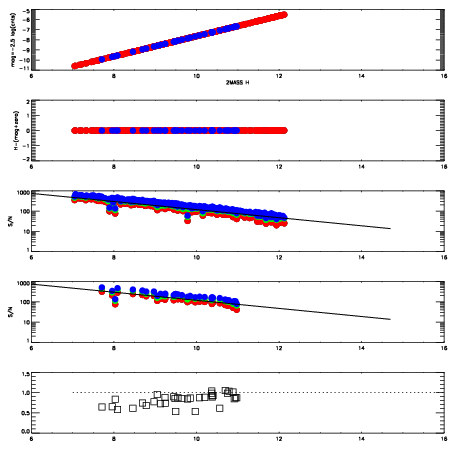
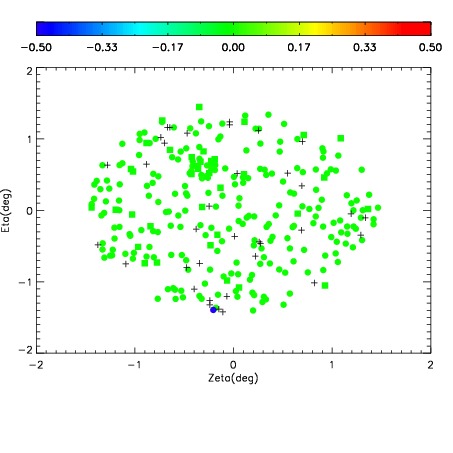
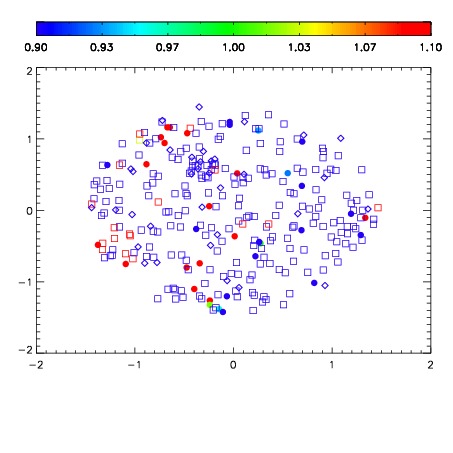
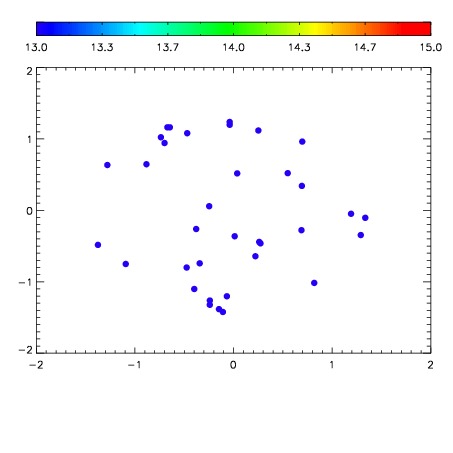

| Frame | Nreads | Zeropoints | Mag plots | Spatial mag deviation | Spatial sky 16325A emission deviations (filled: sky, open: star) | Spatial sky continuum emission | Spatial sky telluric CO2 absorption deviations (filled: H < 10) | |||||||||||||||||||||||
| 0 | 0 |
|
|
|
|
|
|
| IPAIR | NAME | SHIFT | NEWSHIFT | S/N | NAME | SHIFT | NEWSHIFT | S/N |
| 0 | 17330079 | 0.499264 | 0.00000 | 19.1349 | 17330081 | 0.00403453 | 0.495229 | 19.1282 |
| 1 | 17330083 | 0.496334 | 0.00293002 | 19.1901 | 17330084 | 0.00340344 | 0.495861 | 19.2161 |
| 2 | 17330082 | 0.496998 | 0.00226599 | 19.1872 | 17330080 | 0.00474620 | 0.494518 | 19.1594 |
| 3 | 17330078 | 0.496861 | 0.00240299 | 19.1510 | 17330077 | 0.00000 | 0.499264 | 19.1528 |