| Red | Green | Blue | |
| z | 17.64 | ||
| znorm | Inf | ||
| sky | -Inf | -Inf | -NaN |
| S/N | 30.6 | 47.4 | 56.9 |
| S/N(c) | 0.0 | 0.0 | 0.0 |
| SN(E/C) |
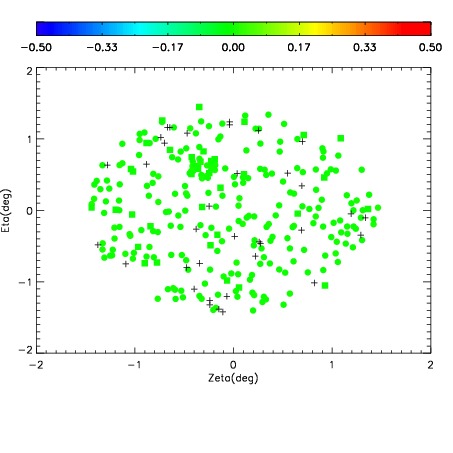
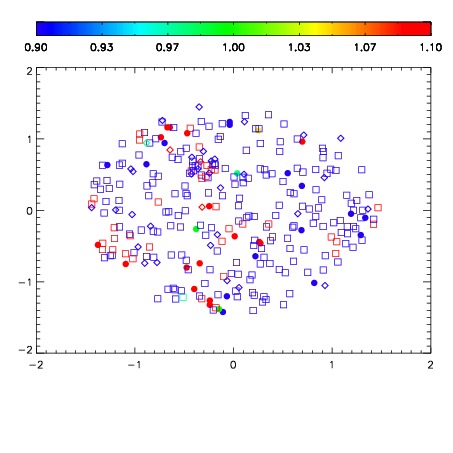
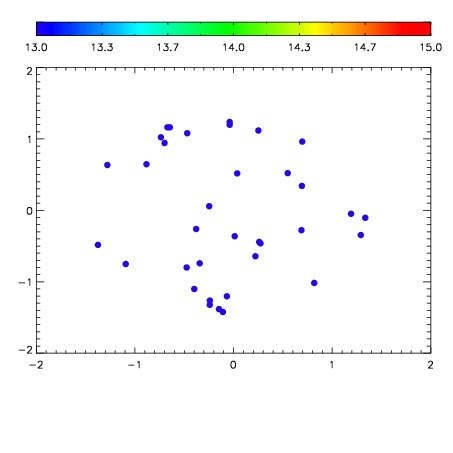

| Frame | Nreads | Zeropoints | Mag plots | Spatial mag deviation | Spatial sky 16325A emission deviations (filled: sky, open: star) | Spatial sky continuum emission | Spatial sky telluric CO2 absorption deviations (filled: H < 10) | |||||||||||||||||||||||
| 0 | 0 |
|
|
|
|
|
|
| IPAIR | NAME | SHIFT | NEWSHIFT | S/N | NAME | SHIFT | NEWSHIFT | S/N |
| 0 | 17670066 | 0.507364 | 0.00000 | 19.1925 | 17670060 | 0.00000 | 0.507364 | 19.1854 |
| 1 | 17670061 | 0.502615 | 0.00474900 | 19.2109 | 17670064 | 0.00419237 | 0.503172 | 19.2066 |
| 2 | 17670065 | 0.506592 | 0.000771999 | 19.2070 | 17670063 | 0.00424312 | 0.503121 | 19.1909 |
| 3 | 17670062 | 0.503342 | 0.00402200 | 19.1555 | 17670067 | 0.00883212 | 0.498532 | 19.1840 |