| Red | Green | Blue | |
| z | 17.64 | ||
| znorm | Inf | ||
| sky | -Inf | -Inf | -NaN |
| S/N | 29.0 | 49.3 | 57.3 |
| S/N(c) | 0.0 | 0.0 | 0.0 |
| SN(E/C) |
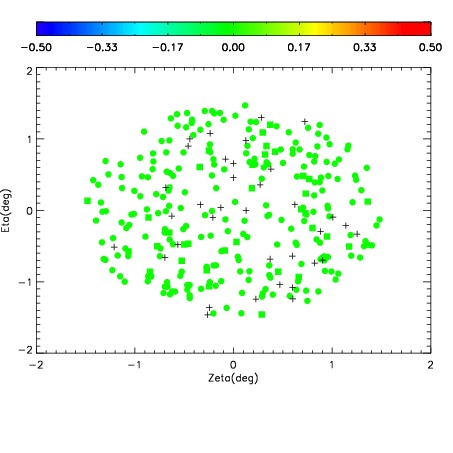
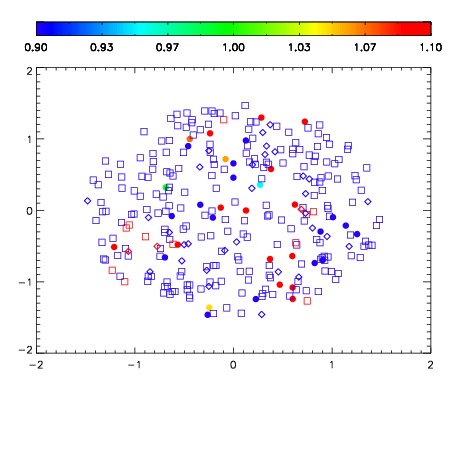


| Frame | Nreads | Zeropoints | Mag plots | Spatial mag deviation | Spatial sky 16325A emission deviations (filled: sky, open: star) | Spatial sky continuum emission | Spatial sky telluric CO2 absorption deviations (filled: H < 10) | |||||||||||||||||||||||
| 0 | 0 |
|
|
|
|
|
|
| IPAIR | NAME | SHIFT | NEWSHIFT | S/N | NAME | SHIFT | NEWSHIFT | S/N |
| 0 | 17310067 | 0.501342 | 0.00000 | 19.1502 | 17310068 | -0.00117542 | 0.502517 | 19.1315 |
| 1 | 17310071 | 0.500157 | 0.00118500 | 19.1601 | 17310069 | -0.00157391 | 0.502916 | 19.1762 |
| 2 | 17310070 | 0.498873 | 0.00246900 | 19.1562 | 17310072 | -0.00191179 | 0.503254 | 19.1584 |
| 3 | 17310066 | 0.500836 | 0.000505984 | 19.1170 | 17310065 | 0.00000 | 0.501342 | 19.0329 |