| Red | Green | Blue | |
| z | 17.64 | ||
| znorm | Inf | ||
| sky | -Inf | -Inf | -Inf |
| S/N | 26.8 | 46.7 | 51.9 |
| S/N(c) | 0.0 | 0.0 | 0.0 |
| SN(E/C) |


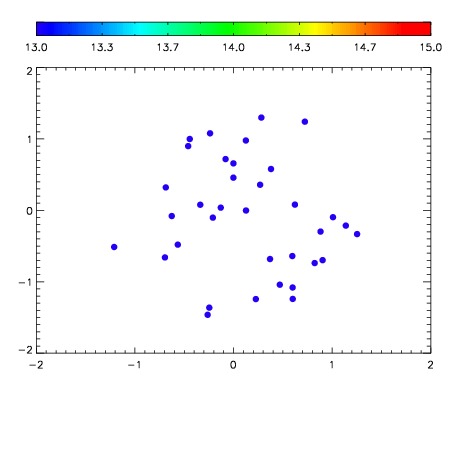

| Frame | Nreads | Zeropoints | Mag plots | Spatial mag deviation | Spatial sky 16325A emission deviations (filled: sky, open: star) | Spatial sky continuum emission | Spatial sky telluric CO2 absorption deviations (filled: H < 10) | |||||||||||||||||||||||
| 0 | 0 |
|
|
|
|
|
|
| IPAIR | NAME | SHIFT | NEWSHIFT | S/N | NAME | SHIFT | NEWSHIFT | S/N |
| 0 | 17340056 | 0.501367 | 0.00000 | 18.7854 | 17340059 | 0.00166904 | 0.499698 | 18.9462 |
| 1 | 17340060 | 0.495483 | 0.00588396 | 19.1347 | 17340058 | 0.00185944 | 0.499508 | 19.1378 |
| 2 | 17340061 | 0.495646 | 0.00572097 | 19.1169 | 17340055 | 0.00000 | 0.501367 | 19.1218 |
| 3 | 17340057 | 0.498804 | 0.00256297 | 19.1017 | 17340062 | 0.000406659 | 0.500960 | 19.0581 |