| Red | Green | Blue | |
| z | 17.64 | ||
| znorm | Inf | ||
| sky | -Inf | -Inf | -Inf |
| S/N | 30.3 | 50.8 | 56.6 |
| S/N(c) | 0.0 | 0.0 | 0.0 |
| SN(E/C) |
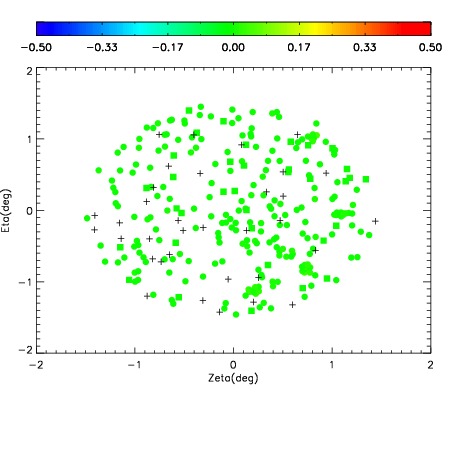
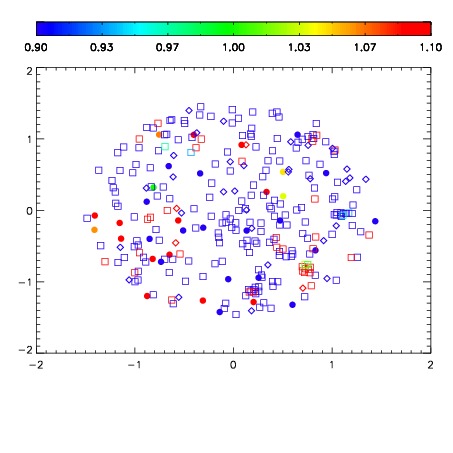


| Frame | Nreads | Zeropoints | Mag plots | Spatial mag deviation | Spatial sky 16325A emission deviations (filled: sky, open: star) | Spatial sky continuum emission | Spatial sky telluric CO2 absorption deviations (filled: H < 10) | |||||||||||||||||||||||
| 0 | 0 |
|
|
|
|
|
|
| IPAIR | NAME | SHIFT | NEWSHIFT | S/N | NAME | SHIFT | NEWSHIFT | S/N |
| 0 | 14650076 | 0.489875 | 0.00000 | 19.1657 | 14650077 | -0.000831095 | 0.490706 | 19.1497 |
| 1 | 14650080 | 0.487536 | 0.00233898 | 19.1989 | 14650074 | 0.00000 | 0.489875 | 19.2120 |
| 2 | 14650075 | 0.489573 | 0.000301987 | 19.1765 | 14650081 | -0.000594785 | 0.490470 | 19.1830 |
| 3 | 14650079 | 0.488344 | 0.00153098 | 19.1743 | 14650078 | -0.000722994 | 0.490598 | 19.1566 |