| Red | Green | Blue | |
| z | 17.64 | ||
| znorm | Inf | ||
| sky | -Inf | -Inf | -Inf |
| S/N | 30.3 | 50.2 | 54.9 |
| S/N(c) | 0.0 | 0.0 | 0.0 |
| SN(E/C) |
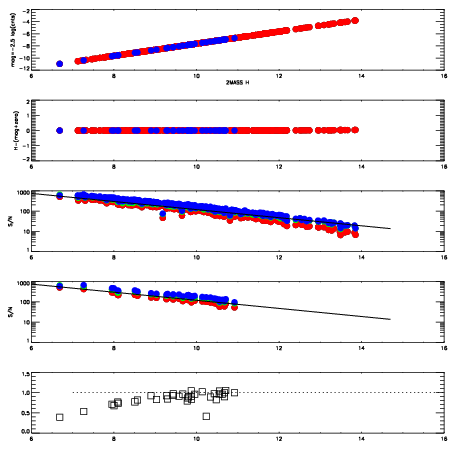


| Frame | Nreads | Zeropoints | Mag plots | Spatial mag deviation | Spatial sky 16325A emission deviations (filled: sky, open: star) | Spatial sky continuum emission | Spatial sky telluric CO2 absorption deviations (filled: H < 10) | |||||||||||||||||||||||
| 0 | 0 |
|
|
|
|
|
|
| IPAIR | NAME | SHIFT | NEWSHIFT | S/N | NAME | SHIFT | NEWSHIFT | S/N |
| 0 | 15470013 | 0.492736 | 0.00000 | 19.2062 | 15470015 | 0.000174180 | 0.492562 | 19.2250 |
| 1 | 15470017 | 0.490240 | 0.00249600 | 19.2237 | 15470019 | -0.00137682 | 0.494113 | 19.2570 |
| 2 | 15470018 | 0.489648 | 0.00308800 | 19.2158 | 15470016 | -0.000609238 | 0.493345 | 19.2275 |
| 3 | 15470014 | 0.492267 | 0.000468999 | 19.2021 | 15470012 | 0.00000 | 0.492736 | 19.2053 |