| Red | Green | Blue | |
| z | 17.64 | ||
| znorm | Inf | ||
| sky | -Inf | -Inf | -Inf |
| S/N | 16.1 | 29.6 | 32.0 |
| S/N(c) | 0.0 | 0.0 | 0.0 |
| SN(E/C) |
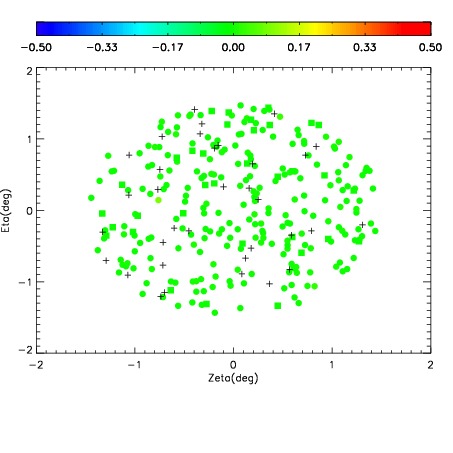
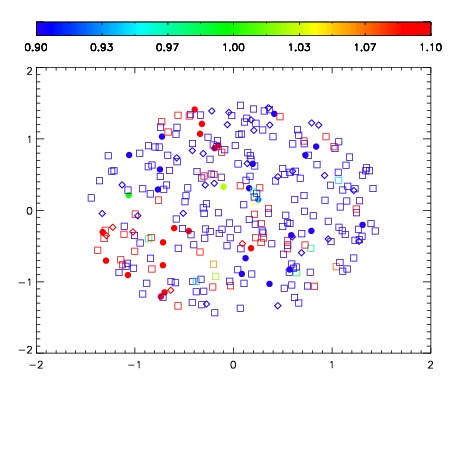


| Frame | Nreads | Zeropoints | Mag plots | Spatial mag deviation | Spatial sky 16325A emission deviations (filled: sky, open: star) | Spatial sky continuum emission | Spatial sky telluric CO2 absorption deviations (filled: H < 10) | |||||||||||||||||||||||
| 0 | 0 |
|
|
|
|
|
|
| IPAIR | NAME | SHIFT | NEWSHIFT | S/N | NAME | SHIFT | NEWSHIFT | S/N |
| 0 | 14940055 | 0.499788 | 0.00000 | 18.1888 | 14940049 | 0.00000 | 0.499788 | 17.9476 |
| 1 | 14940051 | 0.497838 | 0.00195000 | 18.5409 | 14940053 | 5.01194e-05 | 0.499738 | 18.6197 |
| 2 | 14940050 | 0.497922 | 0.00186598 | 18.4254 | 14940052 | 0.000345733 | 0.499442 | 18.6195 |
| 3 | 14940054 | 0.498797 | 0.000990987 | 18.3200 | 14940056 | 0.000106187 | 0.499682 | 18.3794 |