| Red | Green | Blue | |
| z | 17.64 | ||
| znorm | Inf | ||
| sky | -Inf | -Inf | -Inf |
| S/N | 30.5 | 49.7 | 56.1 |
| S/N(c) | 0.0 | 0.0 | 0.0 |
| SN(E/C) |
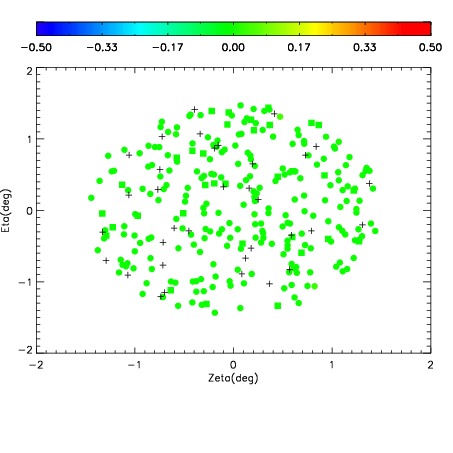
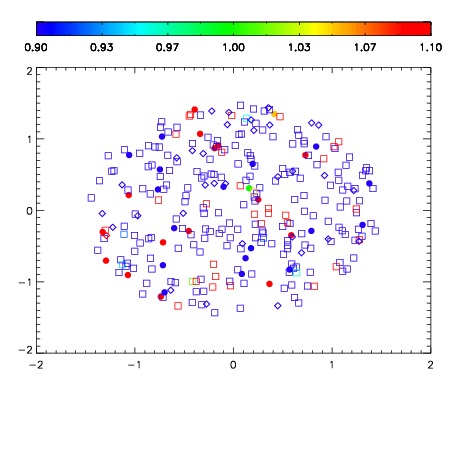


| Frame | Nreads | Zeropoints | Mag plots | Spatial mag deviation | Spatial sky 16325A emission deviations (filled: sky, open: star) | Spatial sky continuum emission | Spatial sky telluric CO2 absorption deviations (filled: H < 10) | |||||||||||||||||||||||
| 0 | 0 |
|
|
|
|
|
|
| IPAIR | NAME | SHIFT | NEWSHIFT | S/N | NAME | SHIFT | NEWSHIFT | S/N |
| 0 | 14980032 | 0.497781 | 0.00000 | 19.1462 | 14980026 | 0.00000 | 0.497781 | 19.0944 |
| 1 | 14980028 | 0.497099 | 0.000681996 | 19.1951 | 14980030 | -0.000120614 | 0.497902 | 19.2170 |
| 2 | 14980031 | 0.496821 | 0.000960022 | 19.1757 | 14980029 | 0.000300516 | 0.497480 | 19.2138 |
| 3 | 14980027 | 0.496698 | 0.00108302 | 19.1232 | 14980033 | -0.000984432 | 0.498765 | 19.0146 |