| Red | Green | Blue | |
| z | 17.64 | ||
| znorm | Inf | ||
| sky | -NaN | -Inf | -Inf |
| S/N | 16.2 | 26.8 | 29.7 |
| S/N(c) | 0.0 | 0.0 | 0.0 |
| SN(E/C) |

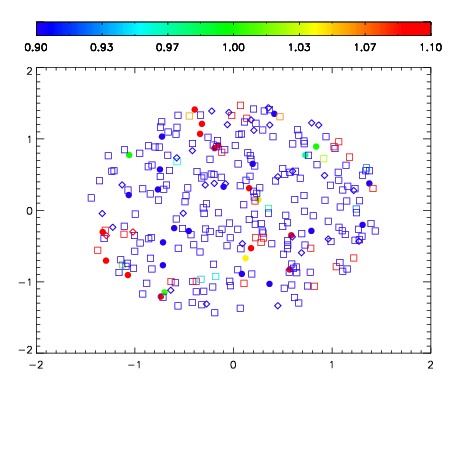


| Frame | Nreads | Zeropoints | Mag plots | Spatial mag deviation | Spatial sky 16325A emission deviations (filled: sky, open: star) | Spatial sky continuum emission | Spatial sky telluric CO2 absorption deviations (filled: H < 10) | |||||||||||||||||||||||
| 0 | 0 |
|
|
|
|
|
|
| IPAIR | NAME | SHIFT | NEWSHIFT | S/N | NAME | SHIFT | NEWSHIFT | S/N |
| 0 | 15260028 | 0.507576 | 0.00000 | 17.5749 | 15260033 | -0.000606830 | 0.508183 | 18.9221 |
| 1 | 15260027 | 0.506209 | 0.00136697 | 18.9584 | 15260026 | 0.00000 | 0.507576 | 19.0129 |
| 2 | 15260032 | 0.506383 | 0.00119299 | 17.2373 | 15260029 | -0.000212171 | 0.507788 | 16.1951 |
| 3 | 15260031 | 0.507121 | 0.000454962 | 15.4629 | 15260030 | 0.000846183 | 0.506730 | 15.8207 |