| Red | Green | Blue | |
| z | 17.64 | ||
| znorm | Inf | ||
| sky | -Inf | -Inf | -NaN |
| S/N | 29.0 | 50.1 | 54.0 |
| S/N(c) | 0.0 | 0.0 | 0.0 |
| SN(E/C) |
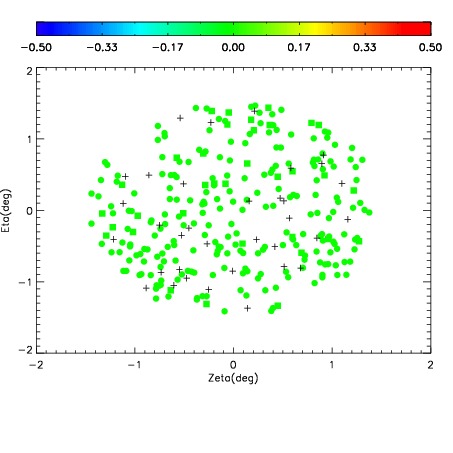
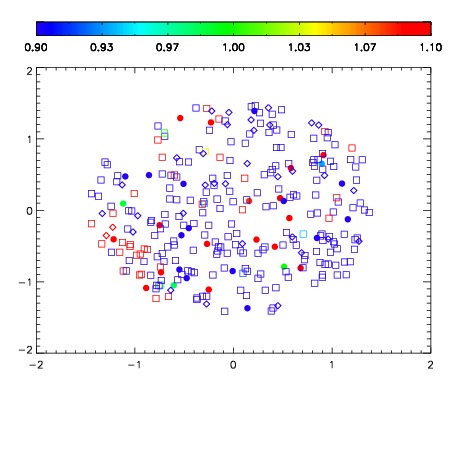
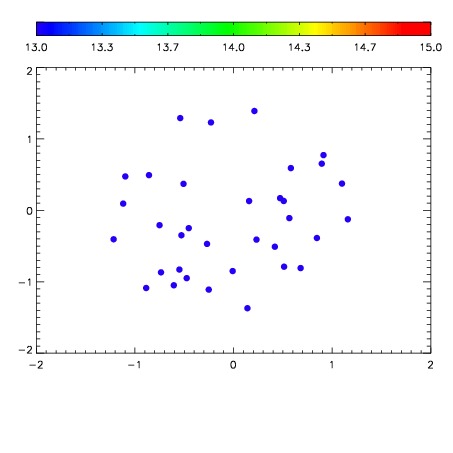

| Frame | Nreads | Zeropoints | Mag plots | Spatial mag deviation | Spatial sky 16325A emission deviations (filled: sky, open: star) | Spatial sky continuum emission | Spatial sky telluric CO2 absorption deviations (filled: H < 10) | |||||||||||||||||||||||
| 0 | 0 |
|
|
|
|
|
|
| IPAIR | NAME | SHIFT | NEWSHIFT | S/N | NAME | SHIFT | NEWSHIFT | S/N |
| 0 | 14950040 | 0.497282 | 0.00000 | 19.1013 | 14950043 | -0.000517785 | 0.497800 | 19.0668 |
| 1 | 14950041 | 0.497100 | 0.000182003 | 19.1471 | 14950042 | -0.000782338 | 0.498064 | 19.1131 |
| 2 | 14950044 | 0.495973 | 0.00130901 | 19.1118 | 14950039 | 0.00000 | 0.497282 | 19.1015 |
| 3 | 14950045 | 0.496367 | 0.000914991 | 19.0668 | 14950046 | -0.000988603 | 0.498271 | 19.0243 |