| Red | Green | Blue | |
| z | 17.64 | ||
| znorm | Inf | ||
| sky | -Inf | -Inf | -Inf |
| S/N | 26.4 | 46.1 | 49.5 |
| S/N(c) | 0.0 | 0.0 | 0.0 |
| SN(E/C) |
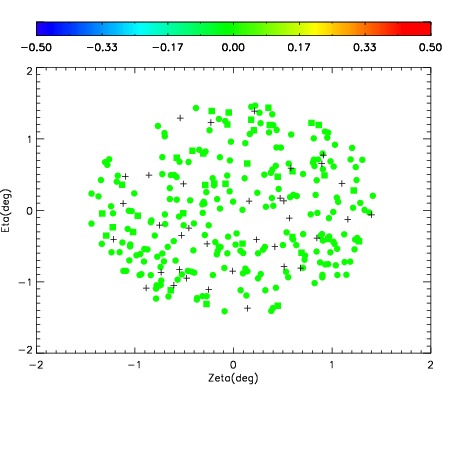
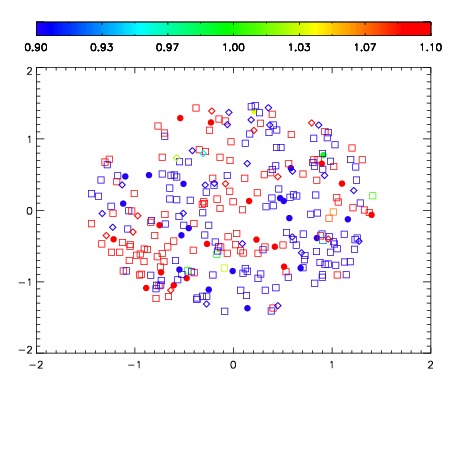
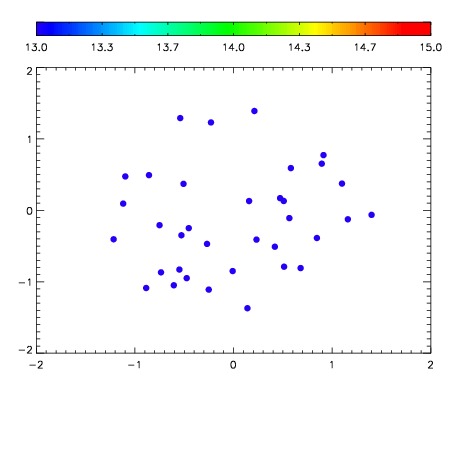

| Frame | Nreads | Zeropoints | Mag plots | Spatial mag deviation | Spatial sky 16325A emission deviations (filled: sky, open: star) | Spatial sky continuum emission | Spatial sky telluric CO2 absorption deviations (filled: H < 10) | |||||||||||||||||||||||
| 0 | 0 |
|
|
|
|
|
|
| IPAIR | NAME | SHIFT | NEWSHIFT | S/N | NAME | SHIFT | NEWSHIFT | S/N |
| 0 | 15000017 | 0.498566 | 0.00000 | 18.9767 | 15000015 | 0.00179476 | 0.496771 | 18.9623 |
| 1 | 15000012 | 0.496379 | 0.00218701 | 19.0279 | 15000014 | 0.00122384 | 0.497342 | 18.9646 |
| 2 | 15000013 | 0.497154 | 0.00141200 | 18.9824 | 15000011 | 0.00000 | 0.498566 | 18.9641 |
| 3 | 15000016 | 0.497678 | 0.000887990 | 18.9371 | 15000018 | 0.00298253 | 0.495583 | 18.8183 |