| Red | Green | Blue | |
| z | 17.64 | ||
| znorm | Inf | ||
| sky | -NaN | -Inf | -NaN |
| S/N | 27.9 | 49.0 | 53.4 |
| S/N(c) | 0.0 | 0.0 | 0.0 |
| SN(E/C) |
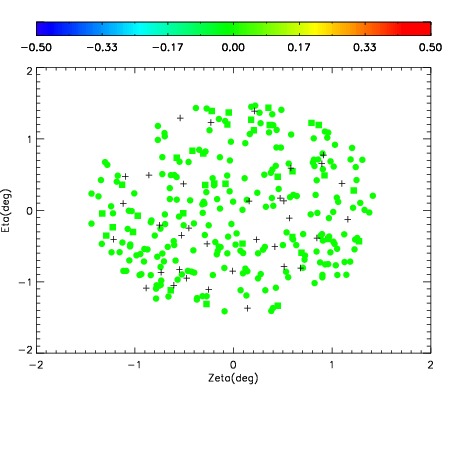
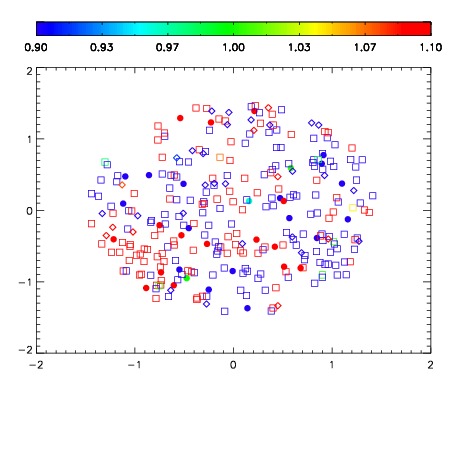
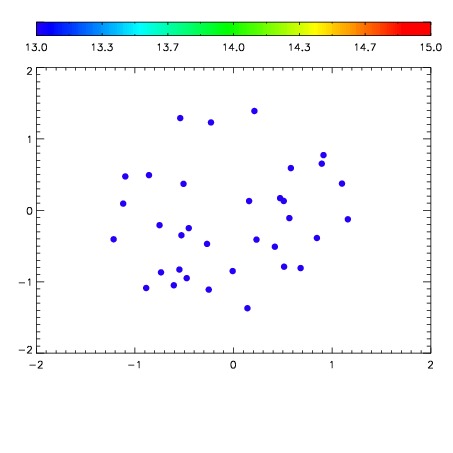

| Frame | Nreads | Zeropoints | Mag plots | Spatial mag deviation | Spatial sky 16325A emission deviations (filled: sky, open: star) | Spatial sky continuum emission | Spatial sky telluric CO2 absorption deviations (filled: H < 10) | |||||||||||||||||||||||
| 0 | 0 |
|
|
|
|
|
|
| IPAIR | NAME | SHIFT | NEWSHIFT | S/N | NAME | SHIFT | NEWSHIFT | S/N |
| 0 | 15460017 | 0.495699 | 0.00000 | 18.9430 | 15460018 | -0.000179998 | 0.495879 | 18.9658 |
| 1 | 15460013 | 0.494791 | 0.000907987 | 19.0872 | 15460011 | 0.00000 | 0.495699 | 19.1234 |
| 2 | 15460012 | 0.494554 | 0.00114498 | 19.0824 | 15460015 | 0.000479350 | 0.495220 | 19.0880 |
| 3 | 15460016 | 0.495398 | 0.000300974 | 19.0352 | 15460014 | 0.000641699 | 0.495057 | 19.0679 |