| Red | Green | Blue | |
| z | 17.64 | ||
| znorm | Inf | ||
| sky | -Inf | -Inf | -NaN |
| S/N | 29.7 | 51.3 | 58.6 |
| S/N(c) | 0.0 | 0.0 | 0.0 |
| SN(E/C) |
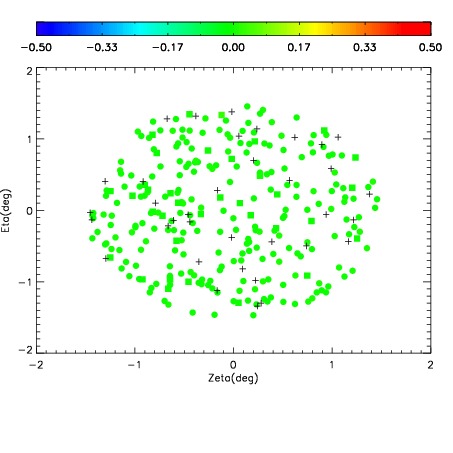

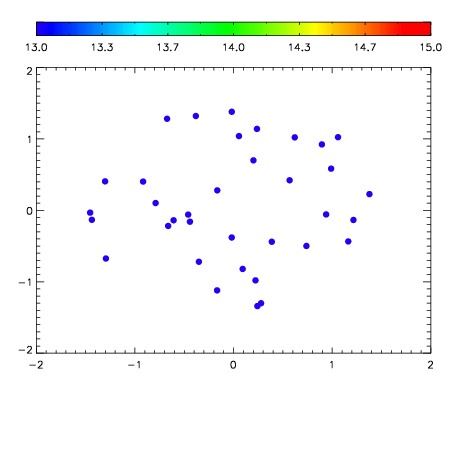

| Frame | Nreads | Zeropoints | Mag plots | Spatial mag deviation | Spatial sky 16325A emission deviations (filled: sky, open: star) | Spatial sky continuum emission | Spatial sky telluric CO2 absorption deviations (filled: H < 10) | |||||||||||||||||||||||
| 0 | 0 |
|
|
|
|
|
|
| IPAIR | NAME | SHIFT | NEWSHIFT | S/N | NAME | SHIFT | NEWSHIFT | S/N |
| 0 | 17350083 | 0.502841 | 0.00000 | 19.1665 | 17350081 | 0.00502922 | 0.497812 | 19.1693 |
| 1 | 17350080 | 0.500394 | 0.00244701 | 19.2116 | 17350082 | 0.00489141 | 0.497950 | 19.1917 |
| 2 | 17350079 | 0.500586 | 0.00225502 | 19.1096 | 17350077 | 0.00316779 | 0.499673 | 19.0480 |
| 3 | 17350075 | 0.499601 | 0.00323999 | 18.9910 | 17350078 | 0.00314225 | 0.499699 | 18.9847 |
| 4 | 17350076 | 0.499883 | 0.00295800 | 18.9809 | 17350074 | 0.00000 | 0.502841 | 18.8325 |