| Red | Green | Blue | |
| z | 17.64 | ||
| znorm | Inf | ||
| sky | -Inf | -Inf | -Inf |
| S/N | 26.1 | 45.3 | 52.2 |
| S/N(c) | 0.0 | 0.0 | 0.0 |
| SN(E/C) |
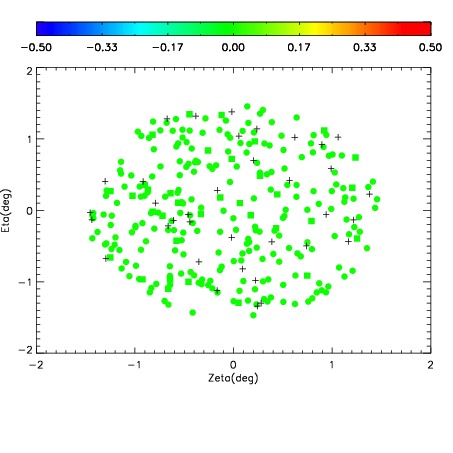
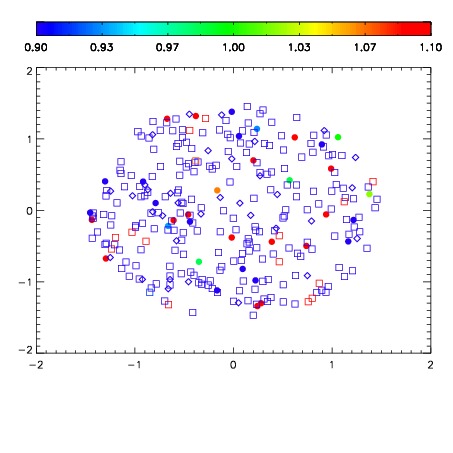
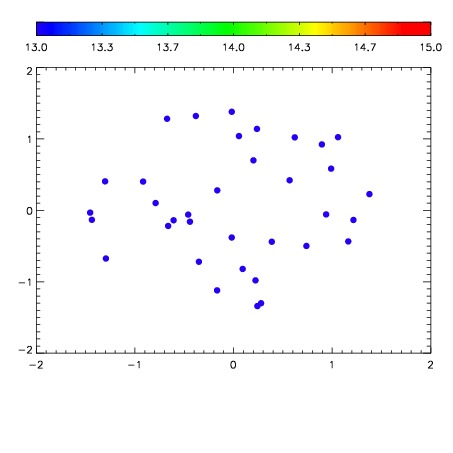

| Frame | Nreads | Zeropoints | Mag plots | Spatial mag deviation | Spatial sky 16325A emission deviations (filled: sky, open: star) | Spatial sky continuum emission | Spatial sky telluric CO2 absorption deviations (filled: H < 10) | |||||||||||||||||||||||
| 0 | 0 |
|
|
|
|
|
|
| IPAIR | NAME | SHIFT | NEWSHIFT | S/N | NAME | SHIFT | NEWSHIFT | S/N |
| 0 | 17960039 | 0.504643 | 0.00000 | 19.0159 | 17960036 | 0.00562095 | 0.499022 | 18.9525 |
| 1 | 17960038 | 0.503479 | 0.00116402 | 19.0389 | 17960040 | 0.00536027 | 0.499283 | 19.0309 |
| 2 | 17960034 | 0.502995 | 0.00164801 | 19.0288 | 17960033 | 0.00000 | 0.504643 | 19.0039 |
| 3 | 17960035 | 0.502042 | 0.00260103 | 19.0262 | 17960037 | 0.00604774 | 0.498595 | 18.9876 |