| Red | Green | Blue | |
| z | 17.64 | ||
| znorm | Inf | ||
| sky | -Inf | -Inf | -NaN |
| S/N | 6.2 | 12.2 | 13.1 |
| S/N(c) | 0.0 | 0.0 | 0.0 |
| SN(E/C) |
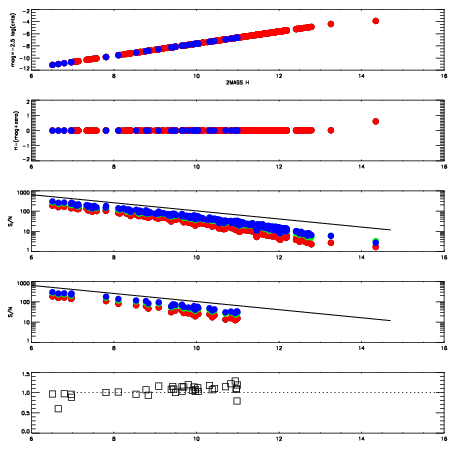
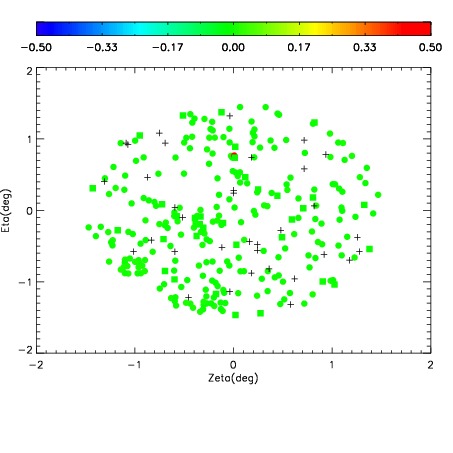
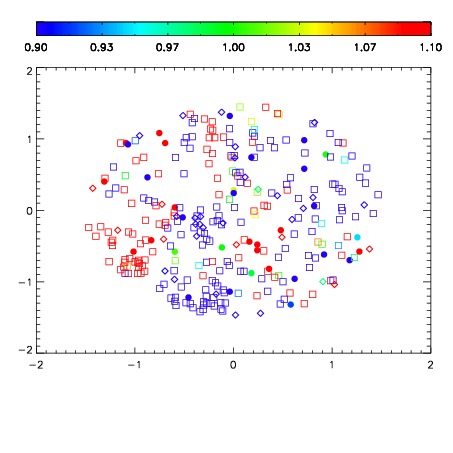
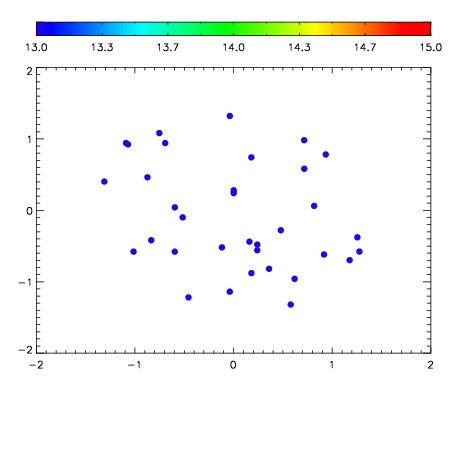

| Frame | Nreads | Zeropoints | Mag plots | Spatial mag deviation | Spatial sky 16325A emission deviations (filled: sky, open: star) | Spatial sky continuum emission | Spatial sky telluric CO2 absorption deviations (filled: H < 10) | |||||||||||||||||||||||
| 0 | 0 |
|
|
|
|
|
|
| IPAIR | NAME | SHIFT | NEWSHIFT | S/N | NAME | SHIFT | NEWSHIFT | S/N |
| 0 | 14150034 | 0.502651 | 0.00000 | 16.9490 | 14150028 | 0.00000 | 0.502651 | 16.0512 |
| 1 | 14150033 | 0.501785 | 0.000865996 | 17.4088 | 14150032 | -0.000871645 | 0.503523 | 18.1213 |
| 2 | 14150030 | 0.501843 | 0.000808001 | 16.7254 | 14150031 | -0.000454591 | 0.503106 | 15.6430 |