| Red | Green | Blue | |
| z | 17.64 | ||
| znorm | Inf | ||
| sky | -Inf | -Inf | -NaN |
| S/N | 24.2 | 41.2 | 46.4 |
| S/N(c) | 0.0 | 0.0 | 0.0 |
| SN(E/C) |
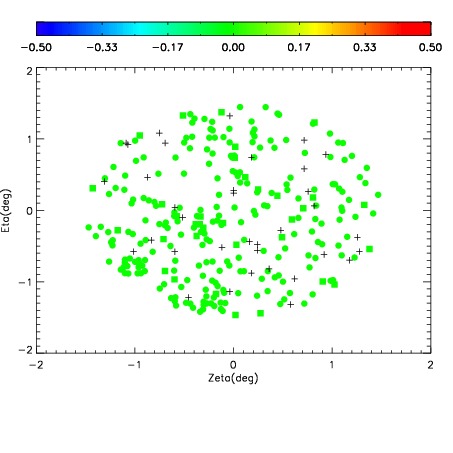
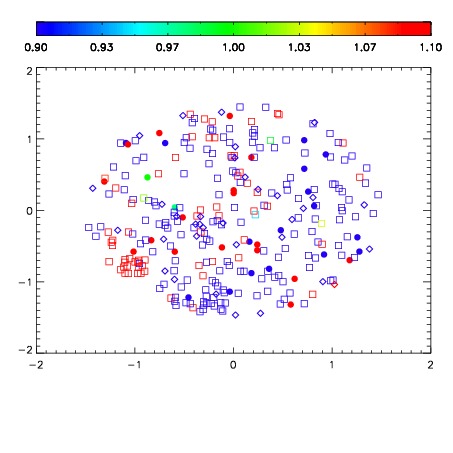
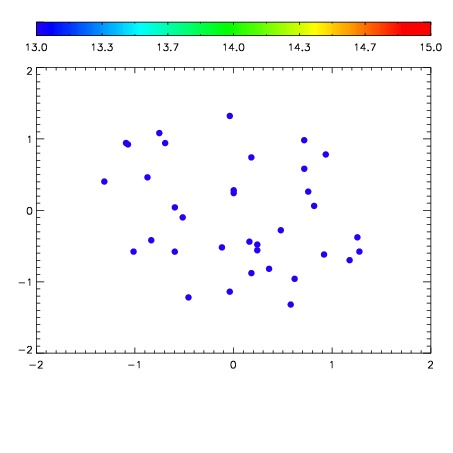

| Frame | Nreads | Zeropoints | Mag plots | Spatial mag deviation | Spatial sky 16325A emission deviations (filled: sky, open: star) | Spatial sky continuum emission | Spatial sky telluric CO2 absorption deviations (filled: H < 10) | |||||||||||||||||||||||
| 0 | 0 |
|
|
|
|
|
|
| IPAIR | NAME | SHIFT | NEWSHIFT | S/N | NAME | SHIFT | NEWSHIFT | S/N |
| 0 | 17620055 | 0.505234 | 0.00000 | 19.0614 | 17620056 | 0.00183012 | 0.503404 | 19.0867 |
| 1 | 17620054 | 0.504457 | 0.000777006 | 19.0346 | 17620049 | 0.00000 | 0.505234 | 19.0222 |
| 2 | 17620050 | 0.504494 | 0.000739992 | 18.6650 | 17620052 | 0.00156436 | 0.503670 | 18.9184 |
| 3 | 17620051 | 0.505231 | 2.98023e-06 | 18.0727 | 17620053 | 0.00135188 | 0.503882 | 18.8093 |