| Red | Green | Blue | |
| z | 17.64 | ||
| znorm | Inf | ||
| sky | -NaN | -Inf | -Inf |
| S/N | 27.8 | 48.2 | 54.6 |
| S/N(c) | 0.0 | 0.0 | 0.0 |
| SN(E/C) |
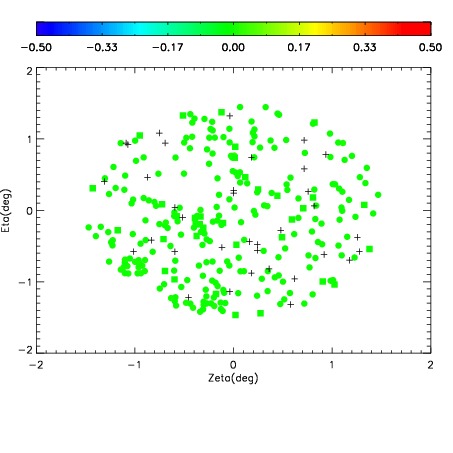
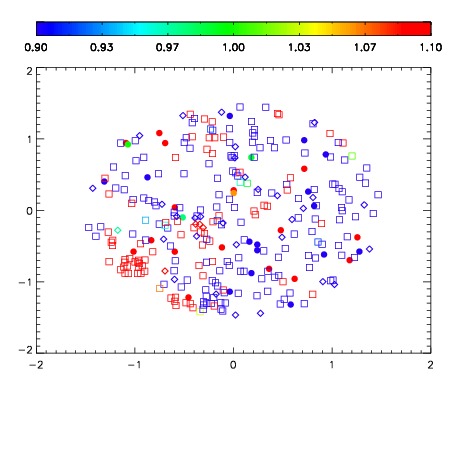
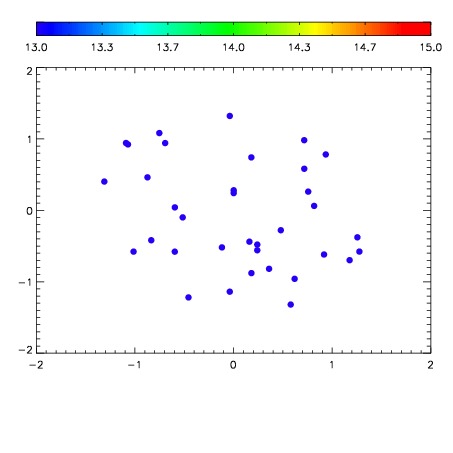

| Frame | Nreads | Zeropoints | Mag plots | Spatial mag deviation | Spatial sky 16325A emission deviations (filled: sky, open: star) | Spatial sky continuum emission | Spatial sky telluric CO2 absorption deviations (filled: H < 10) | |||||||||||||||||||||||
| 0 | 0 |
|
|
|
|
|
|
| IPAIR | NAME | SHIFT | NEWSHIFT | S/N | NAME | SHIFT | NEWSHIFT | S/N |
| 0 | 17690044 | 0.516647 | 0.00000 | 17.9543 | 17690042 | 0.00389730 | 0.512750 | 17.4683 |
| 1 | 17690035 | 0.515208 | 0.00143898 | 19.0146 | 17690037 | 0.00353097 | 0.513116 | 19.0001 |
| 2 | 17690040 | 0.515707 | 0.000939965 | 18.9802 | 17690038 | 0.00388788 | 0.512759 | 18.9574 |
| 3 | 17690039 | 0.515540 | 0.00110698 | 18.9723 | 17690034 | 0.00000 | 0.516647 | 18.9469 |
| 4 | 17690036 | 0.515738 | 0.000908971 | 18.9695 | 17690041 | 0.00439289 | 0.512254 | 18.8806 |
| 5 | 17690043 | 0.515749 | 0.000898004 | 17.7895 | 17690045 | 0.00317397 | 0.513473 | 17.4346 |