| Red | Green | Blue | |
| z | 17.64 | ||
| znorm | Inf | ||
| sky | -NaN | -NaN | -Inf |
| S/N | 29.6 | 48.3 | 56.8 |
| S/N(c) | 0.0 | 0.0 | 0.0 |
| SN(E/C) |
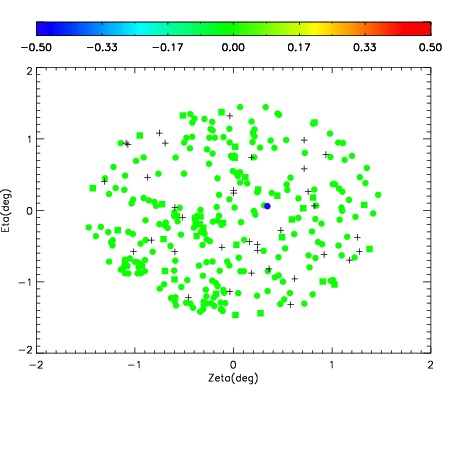
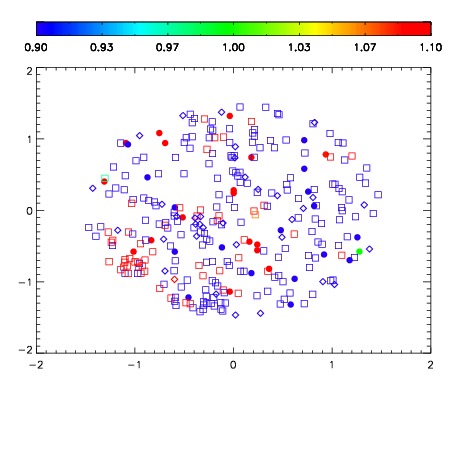
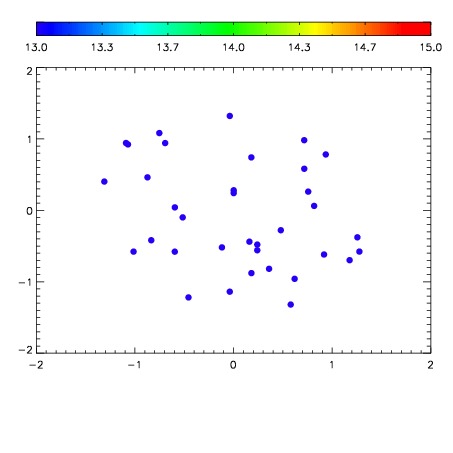

| Frame | Nreads | Zeropoints | Mag plots | Spatial mag deviation | Spatial sky 16325A emission deviations (filled: sky, open: star) | Spatial sky continuum emission | Spatial sky telluric CO2 absorption deviations (filled: H < 10) | |||||||||||||||||||||||
| 0 | 0 |
|
|
|
|
|
|
| IPAIR | NAME | SHIFT | NEWSHIFT | S/N | NAME | SHIFT | NEWSHIFT | S/N |
| 0 | 17950050 | 0.000635449 | 0.00000 | 19.0844 | 17950051 | -0.503206 | 0.503841 | 19.0903 |
| 1 | 17950049 | 0.000474610 | 0.000160839 | 19.0523 | 17950052 | -0.503124 | 0.503759 | 19.0756 |
| 2 | 17950053 | 0.000263059 | 0.000372390 | 19.0486 | 17950048 | -0.505811 | 0.506446 | 19.0334 |
| 3 | 17950046 | 0.00000 | 0.000635449 | 19.0018 | 17950047 | -0.506274 | 0.506909 | 19.0331 |