| Red | Green | Blue | |
| z | 17.64 | ||
| znorm | Inf | ||
| sky | -Inf | -Inf | -NaN |
| S/N | 30.9 | 48.1 | 55.3 |
| S/N(c) | 11.8 | 55.2 | 75.2 |
| SN(E/C) |
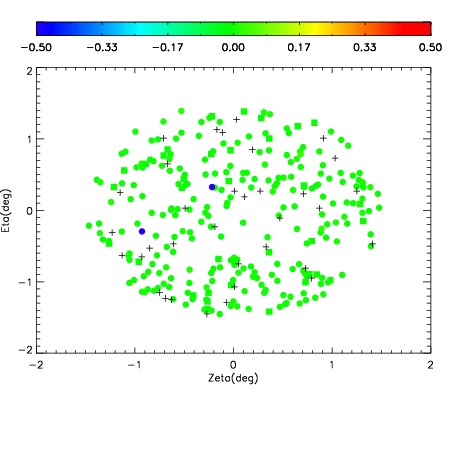
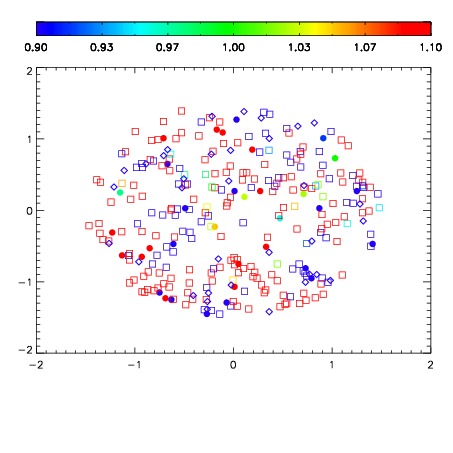
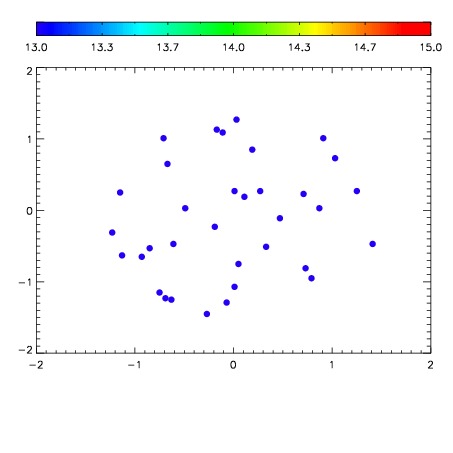

| Frame | Nreads | Zeropoints | Mag plots | Spatial mag deviation | Spatial sky 16325A emission deviations (filled: sky, open: star) | Spatial sky continuum emission | Spatial sky telluric CO2 absorption deviations (filled: H < 10) | |||||||||||||||||||||||
| 0 | 0 |
|
|
|
|
|
|
| IPAIR | NAME | SHIFT | NEWSHIFT | S/N | NAME | SHIFT | NEWSHIFT | S/N |
| 0 | 14950056 | 0.500708 | 0.00000 | 18.9962 | 14950057 | -0.000662370 | 0.501370 | 19.0147 |
| 1 | 14950055 | 0.499929 | 0.000778973 | 18.9703 | 14950054 | -0.000640376 | 0.501348 | 18.9502 |
| 2 | 14950051 | 0.499723 | 0.000984997 | 18.9256 | 14950053 | -0.000490770 | 0.501199 | 18.9465 |
| 3 | 14950052 | 0.499121 | 0.00158697 | 18.9123 | 14950050 | 0.00000 | 0.500708 | 18.8437 |