| Red | Green | Blue | |
| z | 17.64 | ||
| znorm | Inf | ||
| sky | -NaN | -NaN | -NaN |
| S/N | 25.1 | 40.8 | 47.6 |
| S/N(c) | 10.7 | 62.0 | 60.3 |
| SN(E/C) |
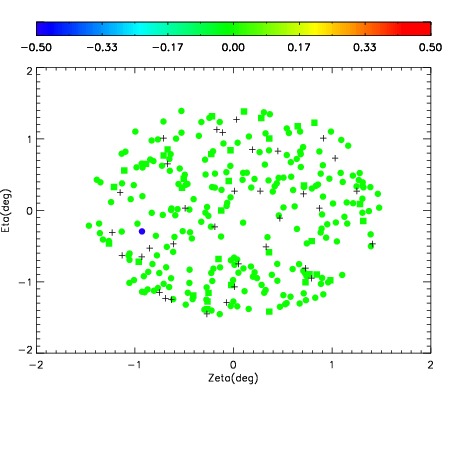

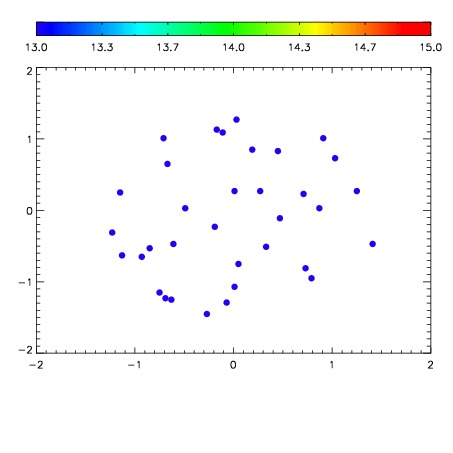

| Frame | Nreads | Zeropoints | Mag plots | Spatial mag deviation | Spatial sky 16325A emission deviations (filled: sky, open: star) | Spatial sky continuum emission | Spatial sky telluric CO2 absorption deviations (filled: H < 10) | |||||||||||||||||||||||
| 0 | 0 |
|
|
|
|
|
|
| IPAIR | NAME | SHIFT | NEWSHIFT | S/N | NAME | SHIFT | NEWSHIFT | S/N |
| 0 | 17960060 | 0.505932 | 0.00000 | 18.5153 | 17960055 | 0.00000 | 0.505932 | 18.6421 |
| 1 | 17960061 | 0.505493 | 0.000438988 | 18.6040 | 17960062 | -0.00188831 | 0.507820 | 18.8306 |
| 2 | 17960057 | 0.505809 | 0.000122964 | 18.5812 | 17960058 | 4.35903e-06 | 0.505928 | 18.7155 |
| 3 | 17960056 | 0.505474 | 0.000458002 | 18.5320 | 17960059 | 0.00128968 | 0.504642 | 18.6713 |