| Red | Green | Blue | |
| z | 17.64 | ||
| znorm | Inf | ||
| sky | -Inf | -Inf | -Inf |
| S/N | 26.9 | 44.2 | 50.6 |
| S/N(c) | 42.0 | 54.1 | 19.3 |
| SN(E/C) |
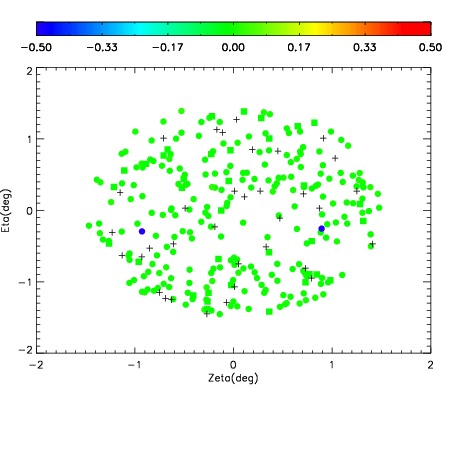
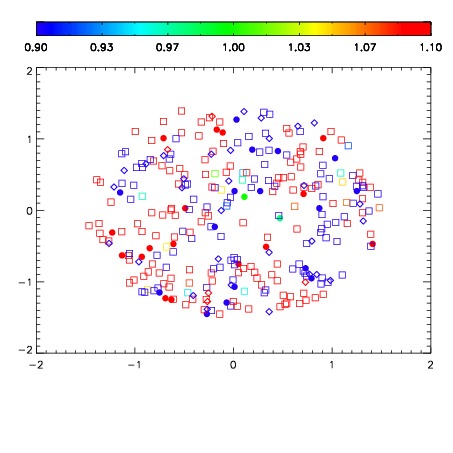
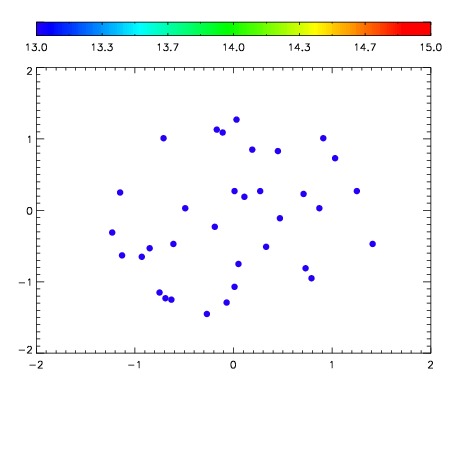

| Frame | Nreads | Zeropoints | Mag plots | Spatial mag deviation | Spatial sky 16325A emission deviations (filled: sky, open: star) | Spatial sky continuum emission | Spatial sky telluric CO2 absorption deviations (filled: H < 10) | |||||||||||||||||||||||
| 0 | 0 |
|
|
|
|
|
|
| IPAIR | NAME | SHIFT | NEWSHIFT | S/N | NAME | SHIFT | NEWSHIFT | S/N |
| 0 | 14670094 | 0.502017 | 0.00000 | 18.8799 | 14670091 | 0.00201650 | 0.500001 | 18.9091 |
| 1 | 14670090 | 0.501482 | 0.000535011 | 18.9513 | 14670095 | 0.00139144 | 0.500626 | 18.9540 |
| 2 | 14670089 | 0.501081 | 0.000936031 | 18.9254 | 14670088 | 0.00000 | 0.502017 | 18.9405 |
| 3 | 14670093 | 0.501591 | 0.000425994 | 18.8798 | 14670092 | 0.00218536 | 0.499832 | 18.8974 |