| Red | Green | Blue | |
| z | 17.64 | ||
| znorm | Inf | ||
| sky | -Inf | -Inf | -Inf |
| S/N | 34.0 | 52.7 | 60.9 |
| S/N(c) | 52.7 | 49.6 | 55.8 |
| SN(E/C) |
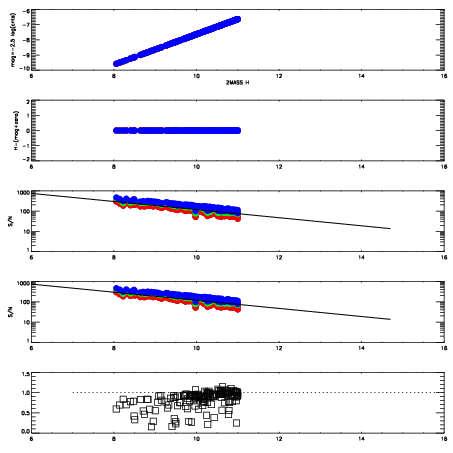
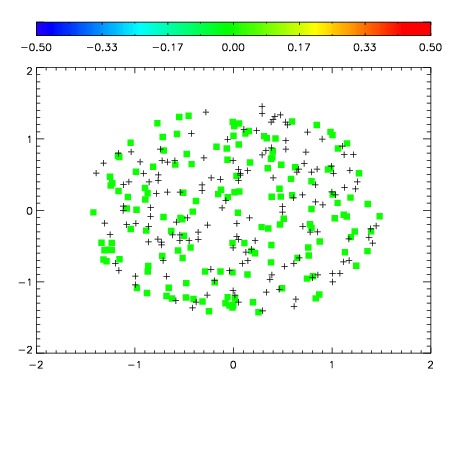
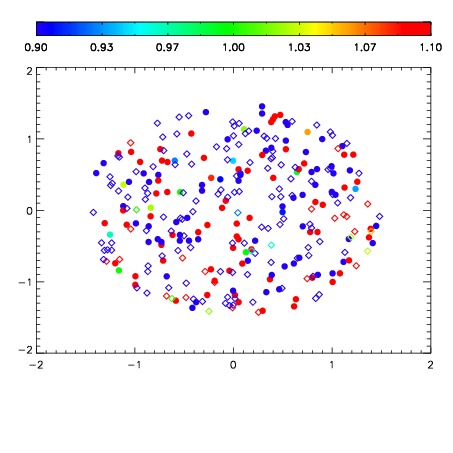
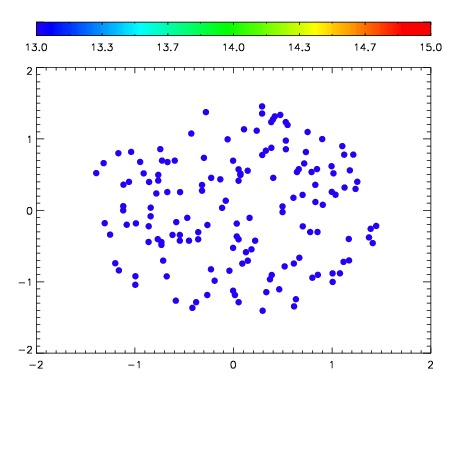

| Frame | Nreads | Zeropoints | Mag plots | Spatial mag deviation | Spatial sky 16325A emission deviations (filled: sky, open: star) | Spatial sky continuum emission | Spatial sky telluric CO2 absorption deviations (filled: H < 10) | |||||||||||||||||||||||
| 0 | 0 |
|
|
|
|
|
|
| IPAIR | NAME | SHIFT | NEWSHIFT | S/N | NAME | SHIFT | NEWSHIFT | S/N |
| 0 | 13400020 | 0.508562 | 0.00000 | 19.1823 | 13400018 | -0.00114654 | 0.509709 | 19.1734 |
| 1 | 13400019 | 0.508037 | 0.000525057 | 19.1829 | 13400021 | 1.34021e-05 | 0.508549 | 19.1737 |
| 2 | 13400015 | 0.506927 | 0.00163502 | 19.1303 | 13400017 | -0.00103832 | 0.509600 | 19.1577 |
| 3 | 13400016 | 0.507612 | 0.000950038 | 19.1292 | 13400014 | 0.00000 | 0.508562 | 19.1264 |