| Red | Green | Blue | |
| z | 17.64 | ||
| znorm | Inf | ||
| sky | -Inf | -Inf | -NaN |
| S/N | 21.0 | 39.0 | 47.5 |
| S/N(c) | 0.0 | 0.0 | 0.0 |
| SN(E/C) |
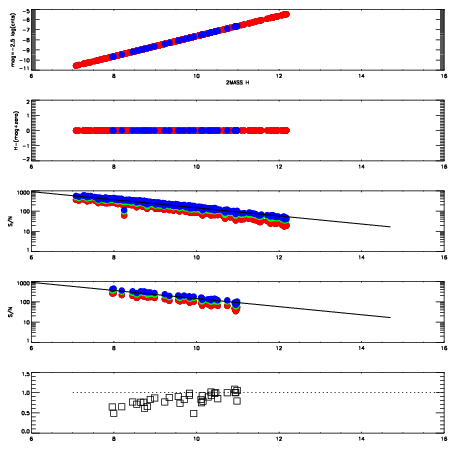
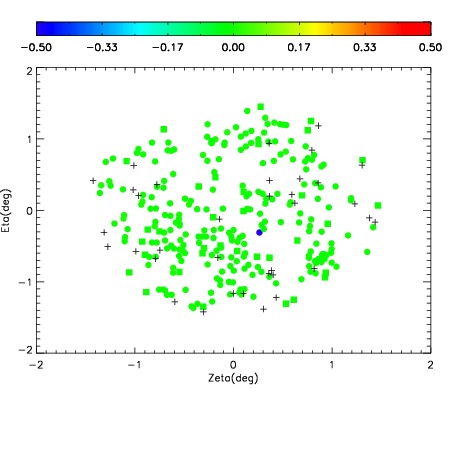
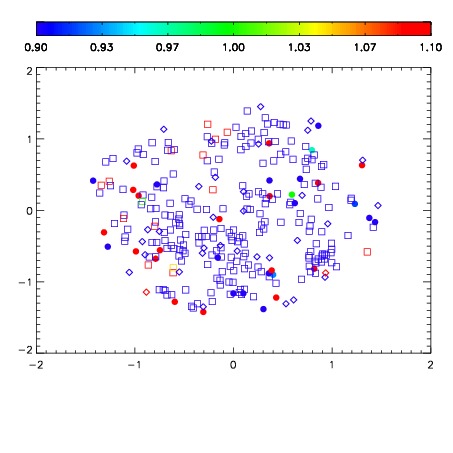


| Frame | Nreads | Zeropoints | Mag plots | Spatial mag deviation | Spatial sky 16325A emission deviations (filled: sky, open: star) | Spatial sky continuum emission | Spatial sky telluric CO2 absorption deviations (filled: H < 10) | |||||||||||||||||||||||
| 0 | 0 |
|
|
|
|
|
|
| IPAIR | NAME | SHIFT | NEWSHIFT | S/N | NAME | SHIFT | NEWSHIFT | S/N |
| 0 | 17050032 | 0.488633 | 0.00000 | 18.8712 | 17050034 | 0.00966223 | 0.478971 | 18.3478 |
| 1 | 17050028 | 0.485055 | 0.00357801 | 19.0567 | 17050029 | 0.00604038 | 0.482593 | 19.0282 |
| 2 | 17050031 | 0.487286 | 0.00134701 | 18.9736 | 17050030 | 0.00607166 | 0.482561 | 18.9345 |
| 3 | 17050027 | 0.485292 | 0.00334102 | 18.6970 | 17050026 | 0.00403766 | 0.484595 | 18.1591 |
| 4 | 17050023 | 0.485284 | 0.00334901 | 18.0699 | 17050033 | 0.00870752 | 0.479925 | 18.0676 |
| 5 | 17050024 | 0.486454 | 0.00217900 | 17.8562 | 17050022 | 0.00000 | 0.488633 | 17.9402 |