| Red | Green | Blue | |
| z | 17.64 | ||
| znorm | Inf | ||
| sky | -Inf | -Inf | -NaN |
| S/N | 6.6 | 12.6 | 14.3 |
| S/N(c) | 0.0 | 0.0 | 0.0 |
| SN(E/C) |
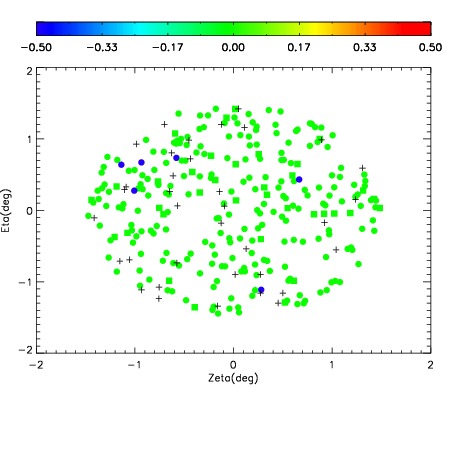
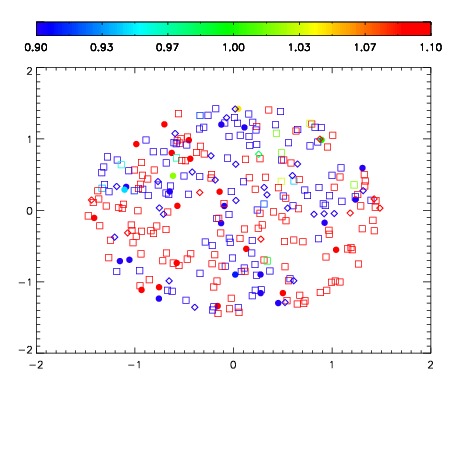
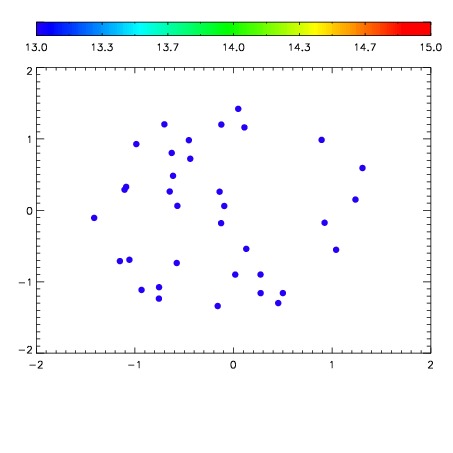

| Frame | Nreads | Zeropoints | Mag plots | Spatial mag deviation | Spatial sky 16325A emission deviations (filled: sky, open: star) | Spatial sky continuum emission | Spatial sky telluric CO2 absorption deviations (filled: H < 10) | |||||||||||||||||||||||
| 0 | 0 |
|
|
|
|
|
|
| IPAIR | NAME | SHIFT | NEWSHIFT | S/N | NAME | SHIFT | NEWSHIFT | S/N |
| 0 | 14380041 | 0.497478 | 0.00000 | 16.2349 | 14380042 | 0.00107918 | 0.496399 | 16.6938 |
| 1 | 14380036 | 0.496234 | 0.00124401 | 17.7587 | 14380035 | 0.00000 | 0.497478 | 17.5392 |
| 2 | 14380037 | 0.496757 | 0.000721008 | 17.6196 | 14380039 | -6.91313e-05 | 0.497547 | 17.3498 |
| 3 | 14380040 | 0.496029 | 0.00144902 | 16.7867 | 14380038 | -0.000122320 | 0.497600 | 16.8475 |