| Red | Green | Blue | |
| z | 17.64 | ||
| znorm | Inf | ||
| sky | -NaN | -NaN | -NaN |
| S/N | 30.2 | 49.5 | 55.7 |
| S/N(c) | 0.0 | 0.0 | 0.0 |
| SN(E/C) |
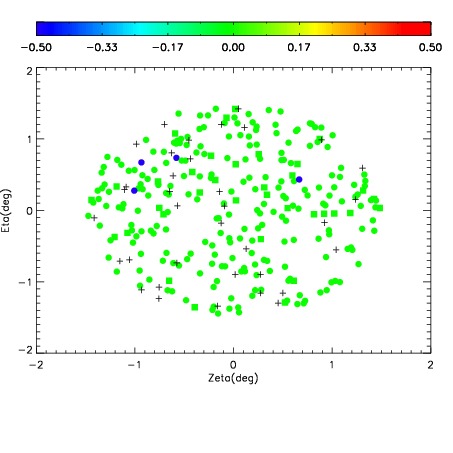
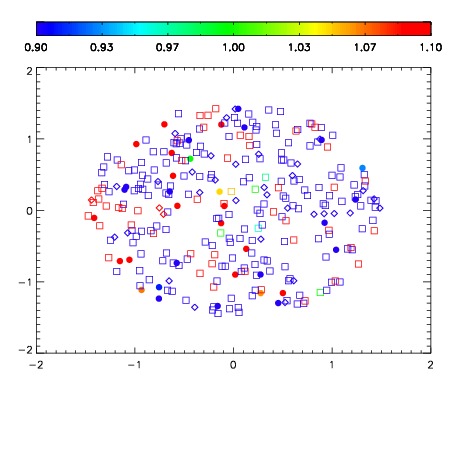
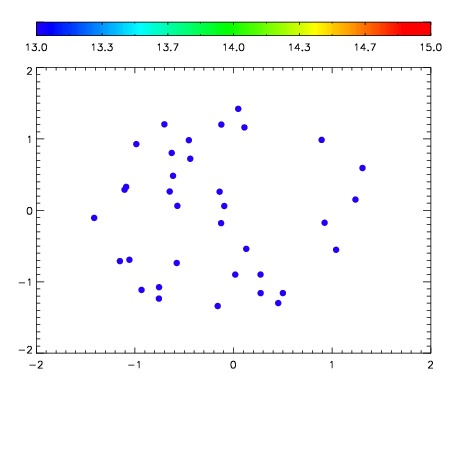

| Frame | Nreads | Zeropoints | Mag plots | Spatial mag deviation | Spatial sky 16325A emission deviations (filled: sky, open: star) | Spatial sky continuum emission | Spatial sky telluric CO2 absorption deviations (filled: H < 10) | |||||||||||||||||||||||
| 0 | 0 |
|
|
|
|
|
|
| IPAIR | NAME | SHIFT | NEWSHIFT | S/N | NAME | SHIFT | NEWSHIFT | S/N |
| 0 | 14410017 | 0.495773 | 0.00000 | 19.2253 | 14410018 | -0.00160803 | 0.497381 | 19.2271 |
| 1 | 14410016 | 0.494914 | 0.000858992 | 19.2007 | 14410014 | -0.00100028 | 0.496773 | 19.1939 |
| 2 | 14410013 | 0.495323 | 0.000449985 | 19.1878 | 14410015 | -0.000737742 | 0.496511 | 19.1916 |
| 3 | 14410012 | 0.495155 | 0.000617981 | 19.1838 | 14410011 | 0.00000 | 0.495773 | 19.1801 |