| Red | Green | Blue | |
| z | 17.64 | ||
| znorm | Inf | ||
| sky | -NaN | -NaN | -NaN |
| S/N | 26.2 | 45.6 | 49.6 |
| S/N(c) | 0.0 | 0.0 | 0.0 |
| SN(E/C) |
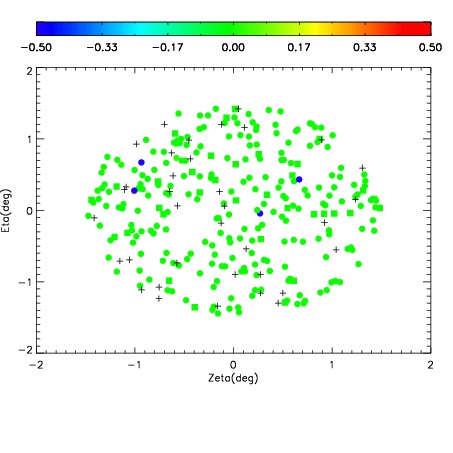
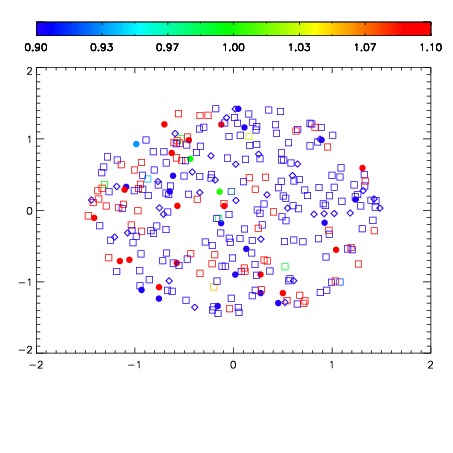


| Frame | Nreads | Zeropoints | Mag plots | Spatial mag deviation | Spatial sky 16325A emission deviations (filled: sky, open: star) | Spatial sky continuum emission | Spatial sky telluric CO2 absorption deviations (filled: H < 10) | |||||||||||||||||||||||
| 0 | 0 |
|
|
|
|
|
|
| IPAIR | NAME | SHIFT | NEWSHIFT | S/N | NAME | SHIFT | NEWSHIFT | S/N |
| 0 | 14670024 | 0.498900 | 0.00000 | 18.9464 | 14670029 | 0.00127409 | 0.497626 | 18.8358 |
| 1 | 14670027 | 0.497166 | 0.00173399 | 19.0110 | 14670022 | 0.00000 | 0.498900 | 19.0457 |
| 2 | 14670023 | 0.498018 | 0.000882000 | 18.9803 | 14670026 | -0.00133654 | 0.500237 | 19.0242 |
| 3 | 14670028 | 0.497653 | 0.00124699 | 18.9465 | 14670025 | -0.000949215 | 0.499849 | 19.0204 |