| Red | Green | Blue | |
| z | 17.64 | ||
| znorm | Inf | ||
| sky | -Inf | -Inf | -Inf |
| S/N | 22.9 | 40.4 | 47.0 |
| S/N(c) | 0.0 | 0.0 | 0.0 |
| SN(E/C) |
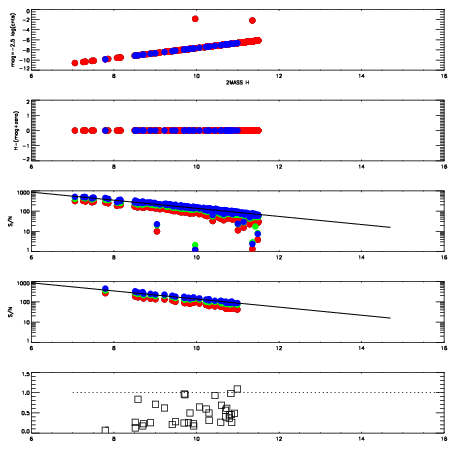
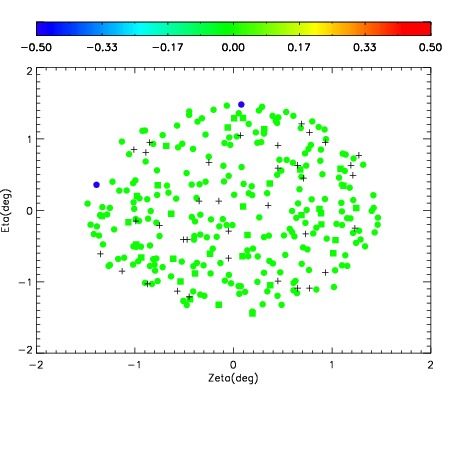
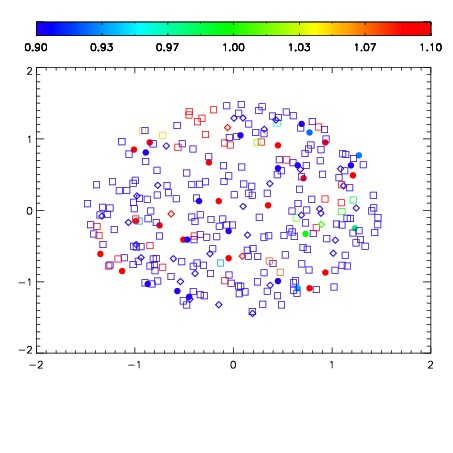
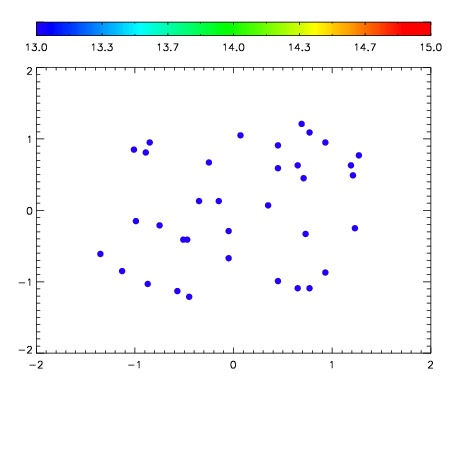

| Frame | Nreads | Zeropoints | Mag plots | Spatial mag deviation | Spatial sky 16325A emission deviations (filled: sky, open: star) | Spatial sky continuum emission | Spatial sky telluric CO2 absorption deviations (filled: H < 10) | |||||||||||||||||||||||
| 0 | 0 |
|
|
|
|
|
|
| IPAIR | NAME | SHIFT | NEWSHIFT | S/N | NAME | SHIFT | NEWSHIFT | S/N |
| 0 | 17450048 | 0.516800 | 0.00000 | 18.2826 | 17450049 | -7.49811e-06 | 0.516807 | 18.3128 |
| 1 | 17450051 | 0.515683 | 0.00111699 | 18.3685 | 17450053 | 0.000574756 | 0.516225 | 18.5586 |
| 2 | 17450047 | 0.516664 | 0.000135958 | 18.3519 | 17450050 | -0.000115516 | 0.516916 | 18.4040 |
| 3 | 17450052 | 0.515666 | 0.00113398 | 18.3264 | 17450046 | 0.00000 | 0.516800 | 18.3782 |
| 4 | 17450055 | 0.512546 | 0.00425398 | 18.1787 | 17450054 | 0.00131139 | 0.515489 | 18.2404 |
| 5 | 17450056 | 0.513283 | 0.00351697 | 17.9901 | 17450057 | 0.00141518 | 0.515385 | 18.0525 |