| Red | Green | Blue | |
| z | 17.64 | ||
| znorm | Inf | ||
| sky | -Inf | -Inf | -Inf |
| S/N | 17.4 | 30.1 | 35.5 |
| S/N(c) | 0.0 | 0.0 | 0.0 |
| SN(E/C) |
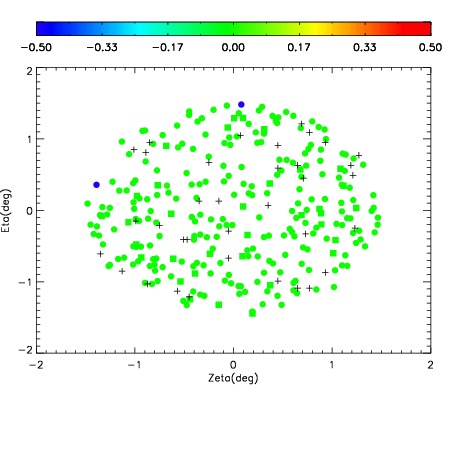
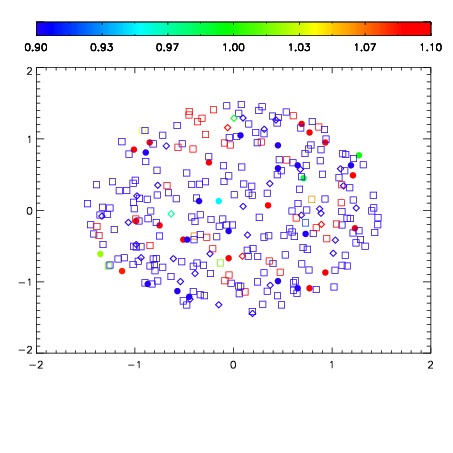
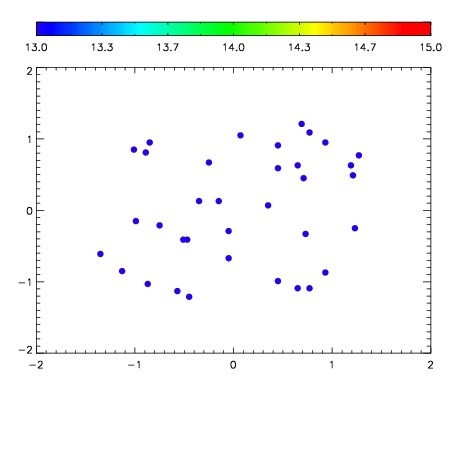

| Frame | Nreads | Zeropoints | Mag plots | Spatial mag deviation | Spatial sky 16325A emission deviations (filled: sky, open: star) | Spatial sky continuum emission | Spatial sky telluric CO2 absorption deviations (filled: H < 10) | |||||||||||||||||||||||
| 0 | 0 |
|
|
|
|
|
|
| IPAIR | NAME | SHIFT | NEWSHIFT | S/N | NAME | SHIFT | NEWSHIFT | S/N |
| 0 | 17460013 | 0.513319 | 0.00000 | 18.2001 | 17460014 | 0.00169657 | 0.511622 | 18.3121 |
| 1 | 17460016 | 0.511644 | 0.00167501 | 18.4883 | 17460015 | 0.00106478 | 0.512254 | 18.5238 |
| 2 | 17460012 | 0.512984 | 0.000335038 | 18.4297 | 17460011 | 0.00000 | 0.513319 | 18.3658 |