| Red | Green | Blue | |
| z | 17.64 | ||
| znorm | Inf | ||
| sky | -Inf | -NaN | -Inf |
| S/N | 32.1 | 55.4 | 64.1 |
| S/N(c) | 0.0 | 0.0 | 0.0 |
| SN(E/C) |
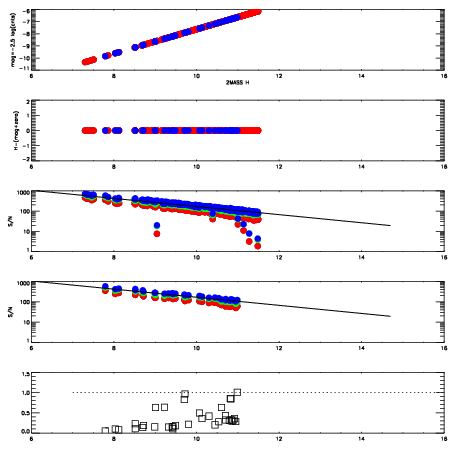
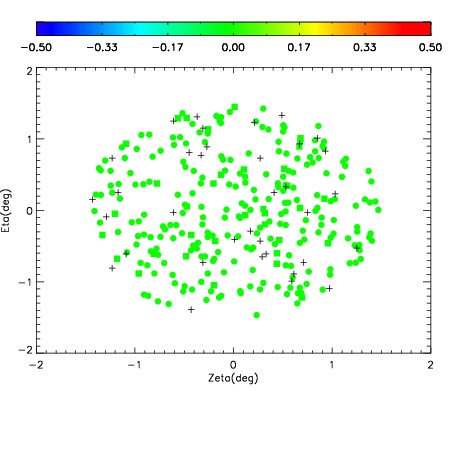
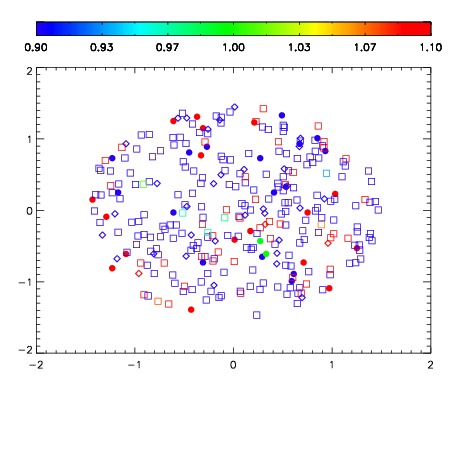
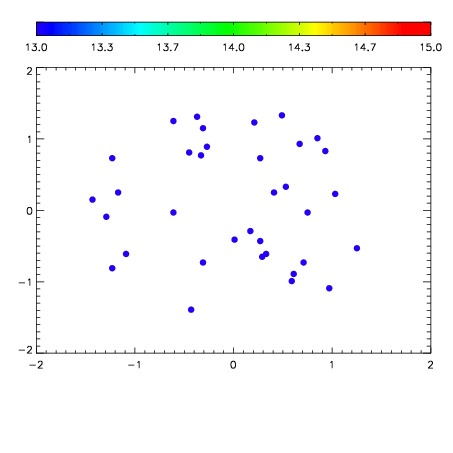

| Frame | Nreads | Zeropoints | Mag plots | Spatial mag deviation | Spatial sky 16325A emission deviations (filled: sky, open: star) | Spatial sky continuum emission | Spatial sky telluric CO2 absorption deviations (filled: H < 10) | |||||||||||||||||||||||
| 0 | 0 |
|
|
|
|
|
|
| IPAIR | NAME | SHIFT | NEWSHIFT | S/N | NAME | SHIFT | NEWSHIFT | S/N |
| 0 | 17470019 | 0.00000 | 0.00000 | 18.2618 | 17470020 | -0.511930 | 0.511930 | 18.2482 |
| 1 | 17470034 | -0.00296559 | 0.00296559 | 18.6699 | 17470033 | -0.508729 | 0.508729 | 18.6608 |
| 2 | 17470023 | -0.000771510 | 0.000771510 | 18.5949 | 17470024 | -0.513754 | 0.513754 | 18.6093 |
| 3 | 17470027 | -0.00185819 | 0.00185819 | 18.5100 | 17470032 | -0.509044 | 0.509044 | 18.5225 |
| 4 | 17470022 | -0.000621759 | 0.000621759 | 18.4526 | 17470028 | -0.510254 | 0.510254 | 18.5189 |
| 5 | 17470031 | -0.00298874 | 0.00298874 | 18.3942 | 17470025 | -0.513159 | 0.513159 | 18.3831 |
| 6 | 17470026 | -0.00213892 | 0.00213892 | 18.3835 | 17470021 | -0.511649 | 0.511649 | 18.3580 |
| 7 | 17470030 | -0.00268292 | 0.00268292 | 18.3766 | 17470029 | -0.510336 | 0.510336 | 18.3485 |
| 8 | 17470035 | -0.00300607 | 0.00300607 | 17.9963 | 17470036 | -0.510708 | 0.510708 | 18.1183 |