| Red | Green | Blue | |
| z | 17.64 | ||
| znorm | Inf | ||
| sky | -Inf | -Inf | -NaN |
| S/N | 19.9 | 32.7 | 37.7 |
| S/N(c) | 0.0 | 0.0 | 0.0 |
| SN(E/C) |
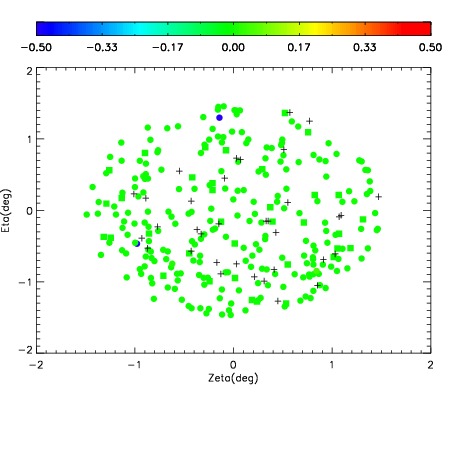
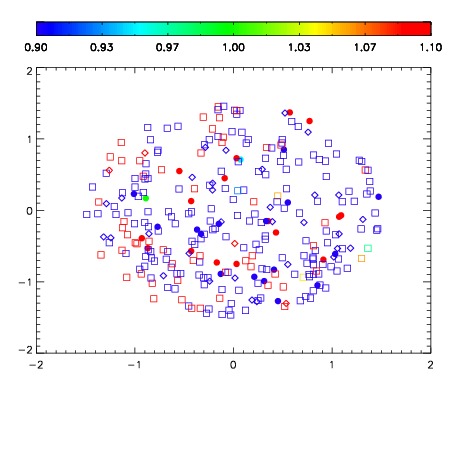
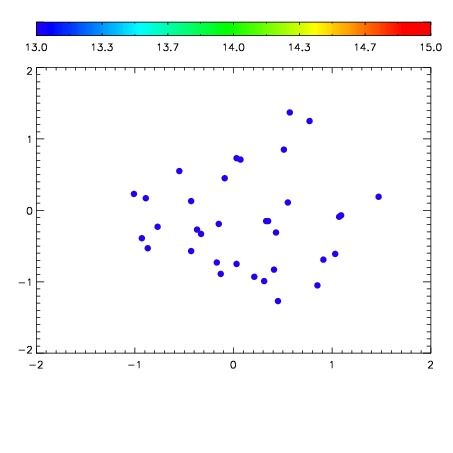

| Frame | Nreads | Zeropoints | Mag plots | Spatial mag deviation | Spatial sky 16325A emission deviations (filled: sky, open: star) | Spatial sky continuum emission | Spatial sky telluric CO2 absorption deviations (filled: H < 10) | |||||||||||||||||||||||
| 0 | 0 |
|
|
|
|
|
|
| IPAIR | NAME | SHIFT | NEWSHIFT | S/N | NAME | SHIFT | NEWSHIFT | S/N |
| 0 | 13930013 | 0.500210 | 0.00000 | 18.5026 | 13930014 | 0.000327242 | 0.499883 | 18.5073 |
| 1 | 13930012 | 0.499227 | 0.000983000 | 18.6298 | 13930011 | 0.00000 | 0.500210 | 18.5921 |
| 2 | 13930016 | 0.499377 | 0.000832975 | 18.5361 | 13930015 | -0.000211486 | 0.500421 | 18.5445 |