| Red | Green | Blue | |
| z | 17.64 | ||
| znorm | Inf | ||
| sky | -Inf | -Inf | -Inf |
| S/N | 26.9 | 46.8 | 51.5 |
| S/N(c) | 0.0 | 0.0 | 0.0 |
| SN(E/C) |
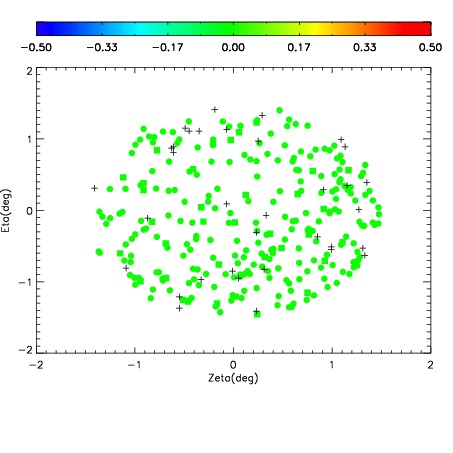
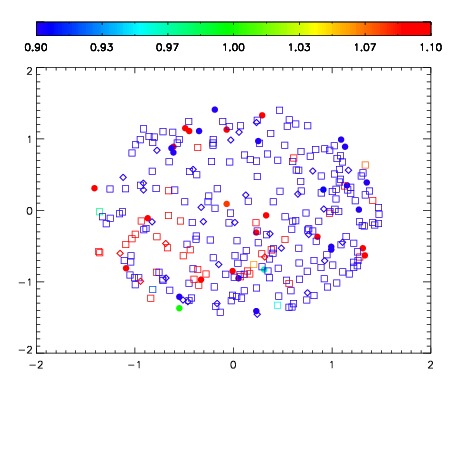
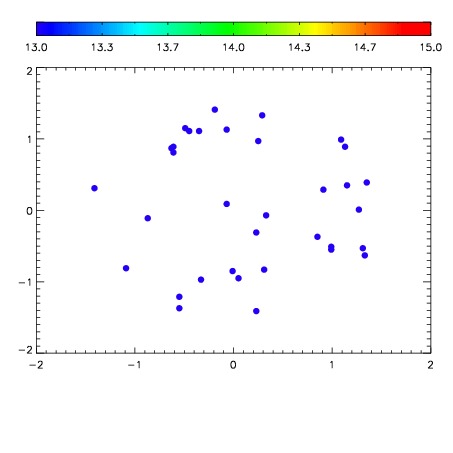

| Frame | Nreads | Zeropoints | Mag plots | Spatial mag deviation | Spatial sky 16325A emission deviations (filled: sky, open: star) | Spatial sky continuum emission | Spatial sky telluric CO2 absorption deviations (filled: H < 10) | |||||||||||||||||||||||
| 0 | 0 |
|
|
|
|
|
|
| IPAIR | NAME | SHIFT | NEWSHIFT | S/N | NAME | SHIFT | NEWSHIFT | S/N |
| 0 | 13930024 | 0.00296175 | 0.00000 | 18.1802 | 13930025 | -0.496999 | 0.499961 | 18.1396 |
| 1 | 13930020 | 0.00000 | 0.00296175 | 18.7905 | 13930021 | -0.498102 | 0.501064 | 18.8494 |
| 2 | 13930027 | -5.87603e-05 | 0.00302051 | 18.7267 | 13930026 | -0.495618 | 0.498580 | 18.7766 |
| 3 | 13930023 | 0.00226049 | 0.000701260 | 18.6807 | 13930022 | -0.497559 | 0.500521 | 18.6235 |
| 4 | 13930028 | 0.00171545 | 0.00124630 | 18.6621 | 13930029 | -0.496673 | 0.499635 | 18.6200 |
| 5 | 13930031 | 0.00258120 | 0.000380550 | 17.5023 | 13930030 | -0.496398 | 0.499360 | 17.6160 |