| Red | Green | Blue | |
| z | 17.64 | ||
| znorm | Inf | ||
| sky | -NaN | -Inf | -Inf |
| S/N | 26.9 | 45.2 | 50.8 |
| S/N(c) | 0.0 | 0.0 | 0.0 |
| SN(E/C) |
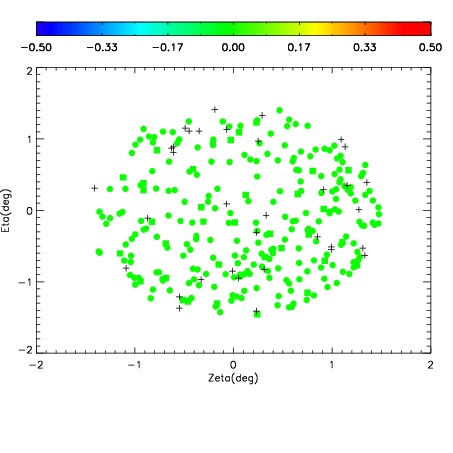
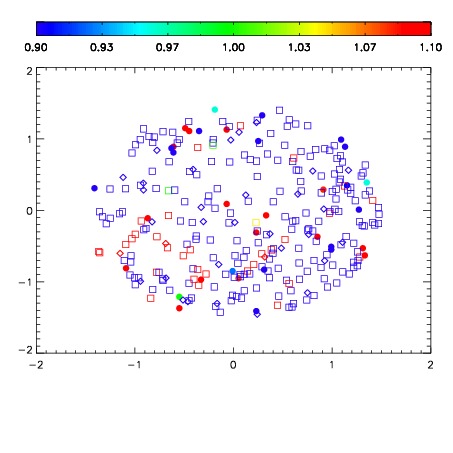
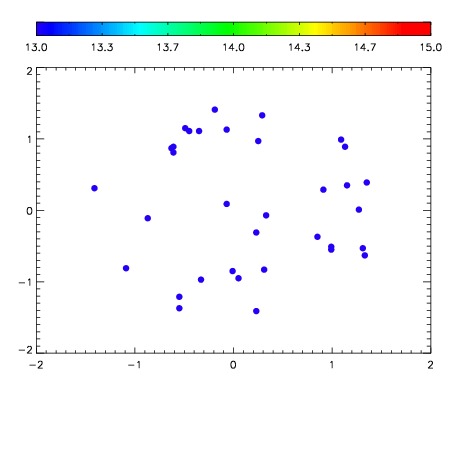

| Frame | Nreads | Zeropoints | Mag plots | Spatial mag deviation | Spatial sky 16325A emission deviations (filled: sky, open: star) | Spatial sky continuum emission | Spatial sky telluric CO2 absorption deviations (filled: H < 10) | |||||||||||||||||||||||
| 0 | 0 |
|
|
|
|
|
|
| IPAIR | NAME | SHIFT | NEWSHIFT | S/N | NAME | SHIFT | NEWSHIFT | S/N |
| 0 | 13940021 | 0.501109 | 0.00000 | 18.1455 | 13940022 | 0.000767247 | 0.500342 | 18.1300 |
| 1 | 13940017 | 0.498584 | 0.00252500 | 18.7482 | 13940018 | -0.00114592 | 0.502255 | 18.7441 |
| 2 | 13940020 | 0.499777 | 0.00133201 | 18.6205 | 13940011 | 0.00000 | 0.501109 | 18.5788 |
| 3 | 13940012 | 0.498512 | 0.00259700 | 18.6035 | 13940019 | -2.78215e-06 | 0.501112 | 18.5163 |
| 4 | 13940016 | 0.500414 | 0.000694990 | 18.4215 | 13940015 | -0.000442306 | 0.501551 | 18.4282 |
| 5 | 13940013 | 0.500798 | 0.000311017 | 18.2829 | 13940014 | 0.000986113 | 0.500123 | 18.3873 |