| Red | Green | Blue | |
| z | 17.64 | ||
| znorm | Inf | ||
| sky | -Inf | -Inf | -Inf |
| S/N | 20.5 | 36.0 | 40.2 |
| S/N(c) | 0.0 | 0.0 | 0.0 |
| SN(E/C) |
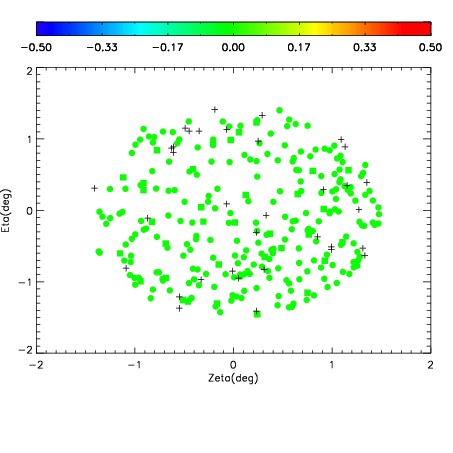
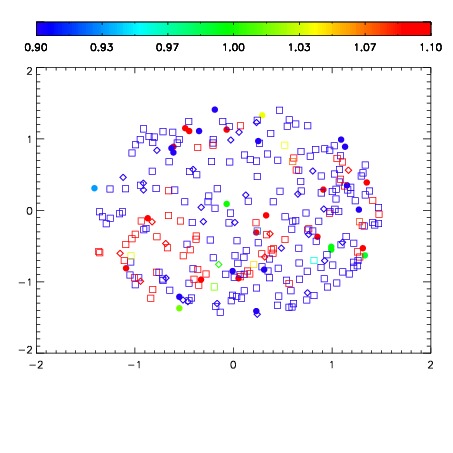
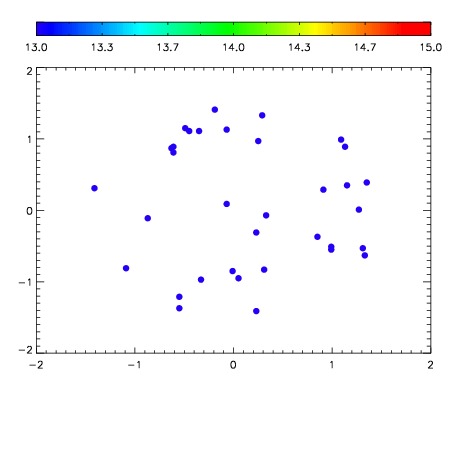

| Frame | Nreads | Zeropoints | Mag plots | Spatial mag deviation | Spatial sky 16325A emission deviations (filled: sky, open: star) | Spatial sky continuum emission | Spatial sky telluric CO2 absorption deviations (filled: H < 10) | |||||||||||||||||||||||
| 0 | 0 |
|
|
|
|
|
|
| IPAIR | NAME | SHIFT | NEWSHIFT | S/N | NAME | SHIFT | NEWSHIFT | S/N |
| 0 | 13950021 | 0.501165 | 0.00000 | 17.5083 | 13950015 | 5.25875e-05 | 0.501112 | 18.0538 |
| 1 | 13950012 | 0.496595 | 0.00456998 | 18.5835 | 13950011 | 0.00000 | 0.501165 | 18.5920 |
| 2 | 13950013 | 0.498523 | 0.00264198 | 18.1759 | 13950018 | -0.00145268 | 0.502618 | 18.4421 |
| 3 | 13950017 | 0.498965 | 0.00219998 | 18.0861 | 13950014 | 0.000360044 | 0.500805 | 18.1753 |
| 4 | 13950016 | 0.499852 | 0.00131297 | 17.6849 | 13950019 | 0.000335351 | 0.500830 | 18.1218 |
| 5 | 13950020 | 0.501096 | 6.89626e-05 | 17.4116 | 13950022 | 0.00122049 | 0.499944 | 17.6329 |