| Red | Green | Blue | |
| z | 17.64 | ||
| znorm | Inf | ||
| sky | -Inf | -Inf | -Inf |
| S/N | 19.6 | 34.4 | 38.0 |
| S/N(c) | 0.0 | 0.0 | 0.0 |
| SN(E/C) |
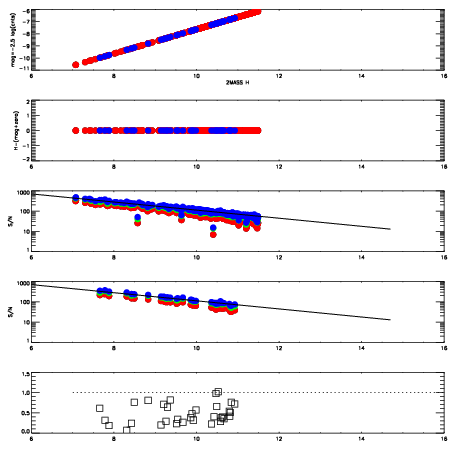
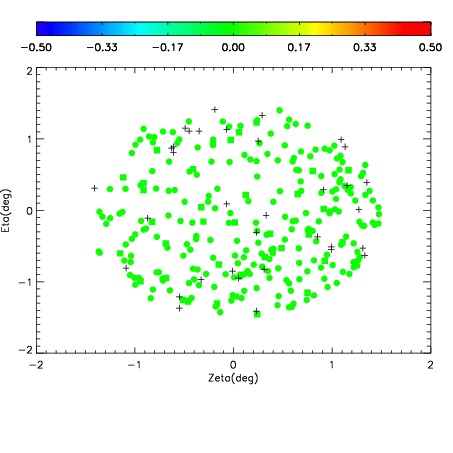
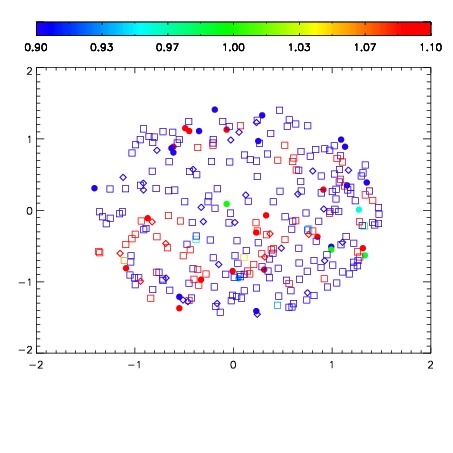
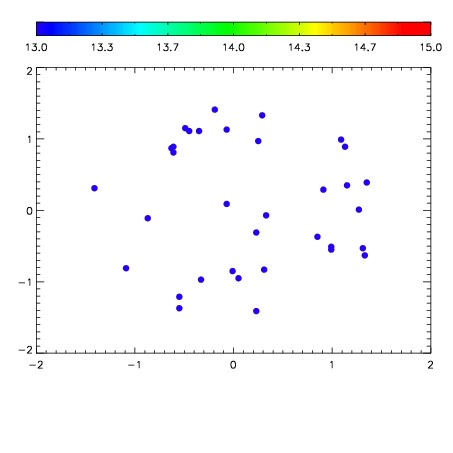

| Frame | Nreads | Zeropoints | Mag plots | Spatial mag deviation | Spatial sky 16325A emission deviations (filled: sky, open: star) | Spatial sky continuum emission | Spatial sky telluric CO2 absorption deviations (filled: H < 10) | |||||||||||||||||||||||
| 0 | 0 |
|
|
|
|
|
|
| IPAIR | NAME | SHIFT | NEWSHIFT | S/N | NAME | SHIFT | NEWSHIFT | S/N |
| 0 | 13960017 | 0.00128173 | 0.00000 | 18.2025 | 13960015 | -0.498138 | 0.499420 | 18.0644 |
| 1 | 13960013 | -0.000678926 | 0.00196066 | 18.5442 | 13960012 | -0.498223 | 0.499505 | 18.5025 |
| 2 | 13960010 | 0.00000 | 0.00128173 | 18.3941 | 13960011 | -0.498411 | 0.499693 | 18.4927 |
| 3 | 13960014 | 0.00100072 | 0.000281010 | 18.2749 | 13960016 | -0.497699 | 0.498981 | 18.2717 |