| Red | Green | Blue | |
| z | 17.64 | ||
| znorm | Inf | ||
| sky | -Inf | -NaN | -Inf |
| S/N | 16.5 | 28.7 | 33.5 |
| S/N(c) | 0.0 | 0.0 | 0.0 |
| SN(E/C) |
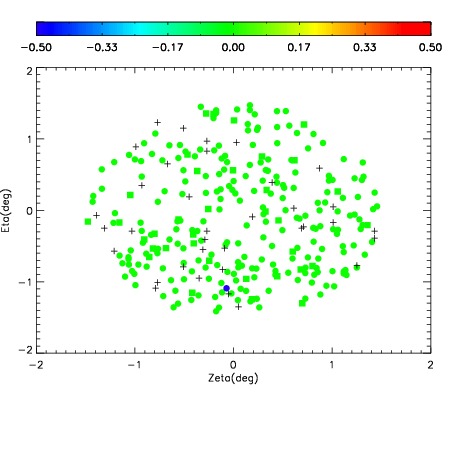
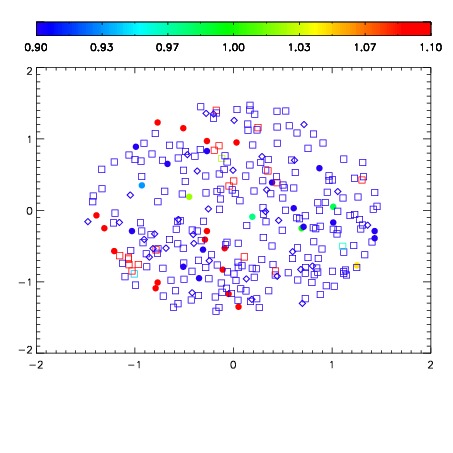
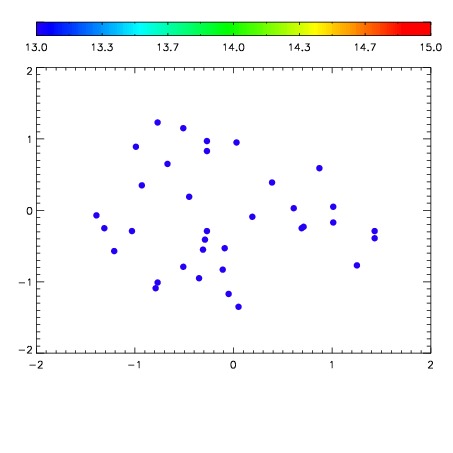

| Frame | Nreads | Zeropoints | Mag plots | Spatial mag deviation | Spatial sky 16325A emission deviations (filled: sky, open: star) | Spatial sky continuum emission | Spatial sky telluric CO2 absorption deviations (filled: H < 10) | |||||||||||||||||||||||
| 0 | 0 |
|
|
|
|
|
|
| IPAIR | NAME | SHIFT | NEWSHIFT | S/N | NAME | SHIFT | NEWSHIFT | S/N |
| 0 | 17780016 | 0.513035 | 0.00000 | 17.8010 | 17780015 | 0.00267688 | 0.510358 | 17.8915 |
| 1 | 17780013 | 0.511974 | 0.00106102 | 18.5306 | 17780014 | 0.00289830 | 0.510137 | 18.5276 |
| 2 | 17780012 | 0.512095 | 0.000940025 | 18.4307 | 17780011 | 0.00000 | 0.513035 | 18.3948 |