| Red | Green | Blue | |
| z | 17.64 | ||
| znorm | Inf | ||
| sky | -Inf | -Inf | -Inf |
| S/N | 22.1 | 36.4 | 42.4 |
| S/N(c) | 0.0 | 0.0 | 0.0 |
| SN(E/C) |
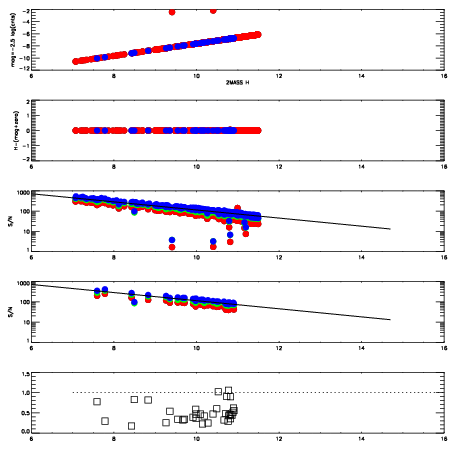
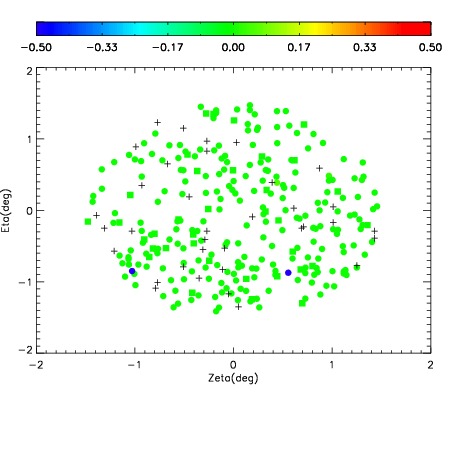
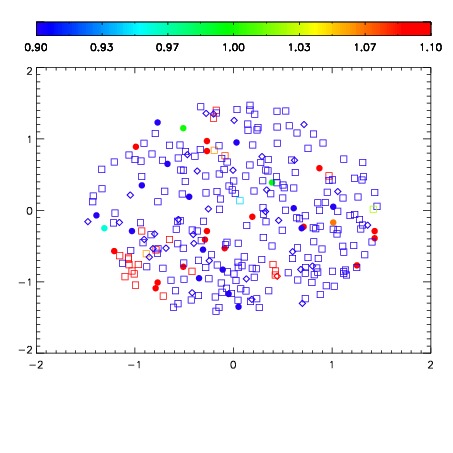
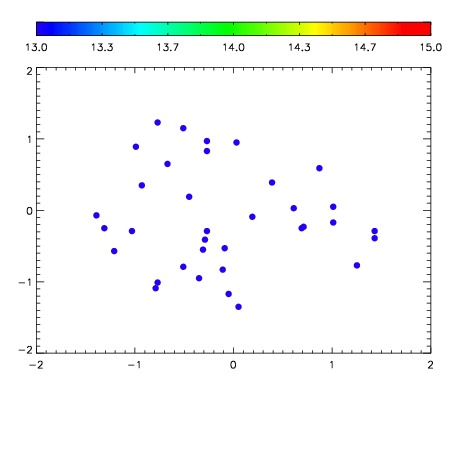

| Frame | Nreads | Zeropoints | Mag plots | Spatial mag deviation | Spatial sky 16325A emission deviations (filled: sky, open: star) | Spatial sky continuum emission | Spatial sky telluric CO2 absorption deviations (filled: H < 10) | |||||||||||||||||||||||
| 0 | 0 |
|
|
|
|
|
|
| IPAIR | NAME | SHIFT | NEWSHIFT | S/N | NAME | SHIFT | NEWSHIFT | S/N |
| 0 | 18610017 | 0.505431 | 0.00000 | 17.9211 | 18610018 | 0.00947986 | 0.495951 | 17.8684 |
| 1 | 18610012 | 0.500761 | 0.00467002 | 18.9873 | 18610011 | 0.00000 | 0.505431 | 18.9740 |
| 2 | 18610016 | 0.504003 | 0.00142801 | 18.4590 | 18610015 | 0.00378219 | 0.501649 | 18.5369 |
| 3 | 18610013 | 0.502623 | 0.00280797 | 18.3234 | 18610014 | 0.00330901 | 0.502122 | 18.3725 |